
Bundle: Essentials of Statistics for The Behavioral Sciences, Loose-Leaf Version, 9th + LMS Integrated Aplia, 1 term Printed Access Card
9th Edition
ISBN: 9781337593885
Author: GRAVETTER
Publisher: CENGAGE L
expand_more
expand_more
format_list_bulleted
Videos
Textbook Question
Chapter 12, Problem 11P
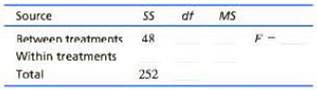
A developmental psychologist is examining the development of language skills from age 2 to age 4. Three different groups of children are obtained, one for each age, with n — 18 children in each group. Each child is given a language-skills assessment test. The resulting data were analyzed with an ANOVA to test for mean differences between age groups. The results of the ANOVA are presented in the following table. Fill in all missing, values.
Expert Solution & Answer
Want to see the full answer?
Check out a sample textbook solution
Students have asked these similar questions
2
Make a histogram from this data set of test
scores: 72, 79, 81, 80, 63, 62, 89, 99, 50,
78, 87, 97, 55, 69, 97, 87, 88, 99, 76, 78,
65, 77, 88, 90, and 81. Would a pie chart be
appropriate for this data?
ganizing Quantitative Data: Charts and Graphs
45
10 Meteorologists use computer models to
predict when and where a hurricane will hit
shore. Suppose they predict that hurricane
Stat has a 20 percent chance of hitting the
East Coast.
a. On what info are the meteorologists
basing this prediction?
b. Why is this prediction harder to make
than your chance of getting a head on
your next coin toss?
U anoia
6. Show that one cannot find independent, identically distributed random variables
X and Y such that X-YE U(-1, 1).
7 Consider al
on
Chapter 12 Solutions
Bundle: Essentials of Statistics for The Behavioral Sciences, Loose-Leaf Version, 9th + LMS Integrated Aplia, 1 term Printed Access Card
Ch. 12.1 - How many levels are there in a single-factor...Ch. 12.1 - When is the distinction between the testwise alpha...Ch. 12.1 - Which of the following accurately describes the...Ch. 12.2 - For an analysis of variance, the differences...Ch. 12.2 - What is suggested by a large value for the F-ratio...Ch. 12.3 - An analysis of variances produces dfbetween...Ch. 12.3 - An analysis of variance is used to evaluate the...Ch. 12.3 - A research study compares three treatments with n...Ch. 12.4 - A researcher uses analysis of variance to test for...Ch. 12.4 - The following table shows the results of an...
Ch. 12.4 - A research report concludes that there are...Ch. 12.5 - Under what circumstances are post hoc tests...Ch. 12.5 - Prob. 2LCCh. 12.6 - Which combination of factors is most likely to...Ch. 12.6 - If an analysis of variance is used for the...Ch. 12.6 - A researcher uses an ANOVA to evaluate the mean...Ch. 12 - Why should you use ANOVA instead of several t...Ch. 12 - What value is expected for the F-ratio, on...Ch. 12 - Describe the similarities between an F-ratio and a...Ch. 12 - Calculate SSwith, SSbetween, SSwithin for the...Ch. 12 - A researcher uses an ANOVA to compare three...Ch. 12 - A researcher reports an F-ratio with dfbetween2...Ch. 12 - A researcher reports an F -ratio with df = 3.24...Ch. 12 - The following values are from an...Ch. 12 - A researcher conducts an experiment comparing four...Ch. 12 - The following summary table presents the results...Ch. 12 - A developmental psychologist is examining the...Ch. 12 - The following data were obtained from an...Ch. 12 - The following data were obtained from an...Ch. 12 - A research study comparing three treatment...Ch. 12 - The following values are from an...Ch. 12 - A research report from an independent-measures...Ch. 12 - Several factors influence the size of the F-ratio....Ch. 12 - A researcher used ANOVA and computed F = 4.25 for...Ch. 12 - The following Data were obtained from an...Ch. 12 - For the preceding problem you should find that...Ch. 12 - The following data summarize the results from an...Ch. 12 - To create the following data we started with the...Ch. 12 - An ANOVA produces an F-ratio with df 1.34. Could...Ch. 12 - The following scores are from an independent...
Knowledge Booster


Learn more about
Need a deep-dive on the concept behind this application? Look no further. Learn more about this topic, statistics and related others by exploring similar questions and additional content below.Similar questions
- 2 Which situation is more likely to produce exactly 50 percent heads: flipping a coin 10 times or flipping a coin 10,000 times?arrow_forward2. Let X1, X2..... X, be independent random variables with expectation 0 and finite third moments. Show, with the aid of characteristic functions, that E(X₁ + X₂++X)³ = EX² + EX²++ EX₁₂-arrow_forward21 Check out the sales of a particular car across the United States over a 60-day period in the following figure. 800- 700- 600- Number of items sold 400 500- Line Graph of Sales 3001 16 12 18 24 30 36 42 48 54 60 60 Day a. Can you see a pattern to the sales of this car across this time period? b. What are the highest and lowest numbers of sales, and when did they occur? c. Can Can you estimate the average of all sales over this time period?arrow_forward
- 11 Bob has glued himself to a certain slot machine for four hours in a row now with his bucket of coins and a bad attitude. He doesn't want to leave because he feels the longer he plays, the better chance he has t win eventually. Is poor Bob right?arrow_forward7 You feel lucky again and buy a handful of instant lottery tickets. The last three tickets you open each win a dollar. Should you buy another ticket because you're "on a roll"?arrow_forward5 Suppose that an NBA player's free throw shooting percentage is 70 percent. a. Explain what this means as a probability. b. What's wrong with thinking that his chances of making his next free throw are 50-50 (because he either makes it or he doesn't)? 78 PART 2 Probability.arrow_forward
- A couple has conceived three girls so far with a fourth baby on the way. Do you predict the newborn will be a girl or a boy? Why?arrow_forward2 Suppose that you flip a coin four times, and it comes up heads each time. Does this outcome give you reason to believe that the coin isn't legitimate? dedo Raupnu stens My be sunildes ad ndaniver uoy no grin PALO STO 2010 COMO IT COUarrow_forward3 Consider tossing a fair coin 10 times and recording the number of heads that occur. a. How many possible outcomes would occur? b. What would be the probability of each of the outcomes? c. How many of the outcomes would have 1 head? What is the probability of 1 head in 10 flips? how d. How many of the outcomes would have o heads? What is the probability of o heads in 10 flips? e. What's the probability of getting 1 head or less on 10 flips of a fair coin?arrow_forward
- 22 Bob decides that after his heart attack is a good time to get in shape, so he starts exer- cising each day and plans to increase his exercise time as he goes along. Look at the two line graphs shown in the following fig- ures. One is a good representation of his data, and the other should get as much use as Bob's treadmill before his heart attack. Exercise time 40 Line Graph 1 of Exercise Log 35 30- 25 201 20 Exercise time 80 80 60 40- 1 10 20 30 30 40 50 60 Day 170 50 80 Line Graph 2 of Exercise Log 1 10 20 90 100 30 30 40 50 60 70 80 90 100 Day a. Compare the two graphs. Do they repre- sent the same data set, or do they show totally different data sets? b. Assume that both graphs are made from the same data. Which graph is more appropriate and why?arrow_forward8 Suppose that a small town has five people with a rare form of cancer. Does this auto- matically mean a huge problem exists that needs to be addressed?arrow_forward1 M&Ms colors come in the following percent- ages: 13 percent brown, 14 percent yellow, 13 percent red, 24 percent blue, 20 percent orange, and 16 percent green. Reach into a bag of M&Ms without looking. a. What's the chance that you pull out a brown or yellow M&M? b. What's the chance that you won't pull out a blue? swarrow_forward
arrow_back_ios
SEE MORE QUESTIONS
arrow_forward_ios
Recommended textbooks for you
 Glencoe Algebra 1, Student Edition, 9780079039897...AlgebraISBN:9780079039897Author:CarterPublisher:McGraw Hill
 Big Ideas Math A Bridge To Success Algebra 1: Stu...AlgebraISBN:9781680331141Author:HOUGHTON MIFFLIN HARCOURTPublisher:Houghton Mifflin Harcourt
 Holt Mcdougal Larson Pre-algebra: Student Edition...AlgebraISBN:9780547587776Author:HOLT MCDOUGALPublisher:HOLT MCDOUGAL
 College Algebra (MindTap Course List)AlgebraISBN:9781305652231Author:R. David Gustafson, Jeff HughesPublisher:Cengage Learning
Glencoe Algebra 1, Student Edition, 9780079039897...
Algebra
ISBN:9780079039897
Author:Carter
Publisher:McGraw Hill
Big Ideas Math A Bridge To Success Algebra 1: Stu...
Algebra
ISBN:9781680331141
Author:HOUGHTON MIFFLIN HARCOURT
Publisher:Houghton Mifflin Harcourt
Holt Mcdougal Larson Pre-algebra: Student Edition...
Algebra
ISBN:9780547587776
Author:HOLT MCDOUGAL
Publisher:HOLT MCDOUGAL
College Algebra (MindTap Course List)
Algebra
ISBN:9781305652231
Author:R. David Gustafson, Jeff Hughes
Publisher:Cengage Learning
Hypothesis Testing using Confidence Interval Approach; Author: BUM2413 Applied Statistics UMP;https://www.youtube.com/watch?v=Hq1l3e9pLyY;License: Standard YouTube License, CC-BY
Hypothesis Testing - Difference of Two Means - Student's -Distribution & Normal Distribution; Author: The Organic Chemistry Tutor;https://www.youtube.com/watch?v=UcZwyzwWU7o;License: Standard Youtube License