Mathematical Statistics with Applications
7th Edition
ISBN: 9780495110811
Author: Dennis Wackerly, William Mendenhall, Richard L. Scheaffer
Publisher: Cengage Learning
bartleby

Concept explainers

bartleby

Videos

Question
Book Icon
Chapter 11.3, Problem 9E

a.

To determine

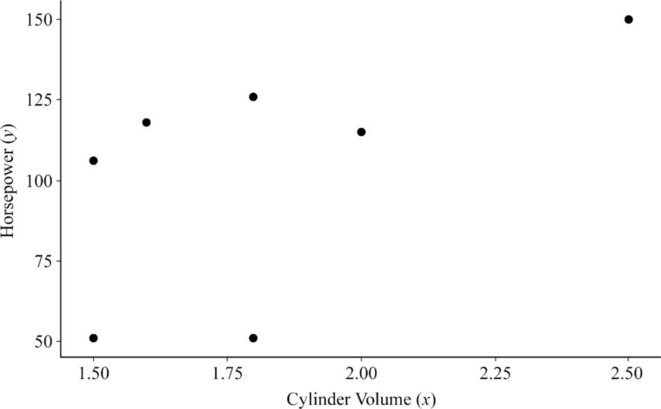
Draw the data points on a graph paper.

a.

Expert Solution
Check Mark

Answer to Problem 9E

The plot of data points on graph paper is represented as follows:

Mathematical Statistics with Applications, Chapter 11.3, Problem 9E , additional homework tip  1

Explanation of Solution

Step-by-step procedure to obtain the graph:

  • Mark the values of x along the horizontal axis from 1.5 to 2.5 at intervals of 0.25 units.
  • Mark the values of y along the vertical axis from 50 to 150 at intervals of 25 units.
  • Plot the point for each value of x with the corresponding value of y.

Thus, the graph is obtained.

b.

To determine

Obtain the least-square line for the data.

b.

Expert Solution
Check Mark

Answer to Problem 9E

The least-square line for the data is y^=15.452+65.172x.

Explanation of Solution

Calculation:

The formula for the mean of y is y¯=1ni=1nyi. The formula for the mean of x is x¯=1ni=1nxi.

The formula for Sxy is Sxy=i=1n(xix¯)(yiy¯). The formula for Sxx is Sxx=i=1n(xix¯)2. The formula for β^1 is β^1=SxySxx. The formula for β^0 is β^0=y¯β^1x¯.

 The calculation is shown below:

Horsepower (y)Cylinder Volume (x)
511.8
511.5
1152
1502.5
1261.8
1502.5
1181.6
1061.5
i=18yi=867i=18x=15.2

Thus, the mean of y and mean of x are obtained as follows:

y¯=1ni=1nyi=8678=108.375

x¯=1ni=1nxi=15.28=1.9

The value of y¯ is 108.375; the value of x¯ is 1.9.

The values of Sxy and Sxx are calculated below:

Sxy=i=1n(xix¯)(yiy¯)=[(1.81.9)(51108.375)+(1.51.9)(51108.375)+...+(1.51.9)(106108.375)]=75.6

Sxx=i=1n(xix¯)2=[(1.81.9)2+(1.51.9)2+..+(1.51.9)2]=1.16

The value of Sxy is 75.6; the value of Sxx is 1.16.

Thus, the values of β^1 and β^0 are obtained as follows:

β^1=SxySxx=75.61.16=65.172

β^0=y¯β^1x¯=108.375(65.172)1.9=108.375123.827=15.452

The value of β^0 is –15.452; the value of β^1 is 65.172.

The straight line is obtained as follows:

y^=β^0+β^1x=15.452+65.172x

Thus, the least-square line for the data is y^=15.452+65.172x.

c.

To determine

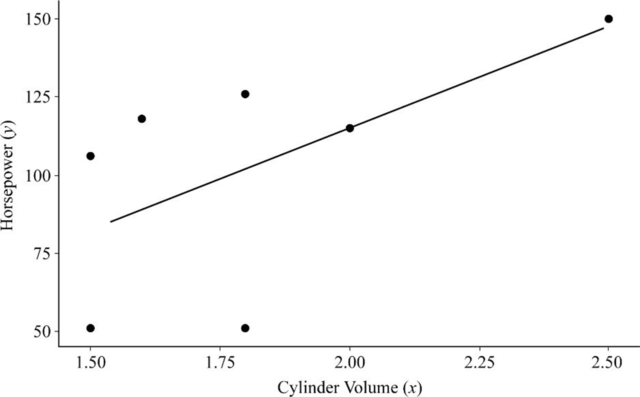
Draw the least-square line on a graph paper.

c.

Expert Solution
Check Mark

Answer to Problem 9E

The graph of a least-square line is represented as follows:

Mathematical Statistics with Applications, Chapter 11.3, Problem 9E , additional homework tip  2

Explanation of Solution

Step-by-step procedure to obtain the straight line:

  • Mark the values of x along the horizontal axis from 1.5 to 2.5 at intervals of 0.25 units.
  • Mark the values of y along the vertical axis from 50 to 150 at intervals of 25 units.
  • Plot the point for each value of x with the corresponding value of y.
  • Draw the line based on the estimated values of β0 and β1.

Thus, the graph is obtained.

d.

To determine

Obtain the estimated value of the mean horsepower rating for a fuel-efficient automobile with cylinder volume 1.9 L.

d.

Expert Solution
Check Mark

Answer to Problem 9E

The estimated value of the mean horsepower rating for a fuel-efficient automobile with cylinder volume 1.9 L is 108.375 Horsepower.

Explanation of Solution

Calculation:

From the part (b), the straight line is y^=15.452+65.172x.

The estimated value of the mean horsepower rating for a fuel-efficient automobile with cylinder volume 1.9 L is calculated as follows:

y^=15.452+65.172x=15.452+65.172(1.9)=15.452+123.827=108.375

Therefore, the estimated value of the mean horsepower rating for a fuel-efficient automobile with cylinder volume 1.9 L is 108.375 Horsepower.

Want to see more full solutions like this?

Subscribe now to access step-by-step solutions to millions of textbook problems written by subject matter experts!
Students have asked these similar questions
Problem 3. Pricing a multi-stock option the Margrabe formula The purpose of this problem is to price a swap option in a 2-stock model, similarly as what we did in the example in the lectures. We consider a two-dimensional Brownian motion given by W₁ = (W(¹), W(2)) on a probability space (Q, F,P). Two stock prices are modeled by the following equations: dX = dY₁ = X₁ (rdt+ rdt+0₁dW!) (²)), Y₁ (rdt+dW+0zdW!"), with Xo xo and Yo =yo. This corresponds to the multi-stock model studied in class, but with notation (X+, Y₁) instead of (S(1), S(2)). Given the model above, the measure P is already the risk-neutral measure (Both stocks have rate of return r). We write σ = 0₁+0%. We consider a swap option, which gives you the right, at time T, to exchange one share of X for one share of Y. That is, the option has payoff F=(Yr-XT). (a) We first assume that r = 0 (for questions (a)-(f)). Write an explicit expression for the process Xt. Reminder before proceeding to question (b): Girsanov's theorem…
Problem 1. Multi-stock model We consider a 2-stock model similar to the one studied in class. Namely, we consider = S(1) S(2) = S(¹) exp (σ1B(1) + (M1 - 0/1 ) S(²) exp (02B(2) + (H₂- M2 where (B(¹) ) +20 and (B(2) ) +≥o are two Brownian motions, with t≥0 Cov (B(¹), B(2)) = p min{t, s}. " The purpose of this problem is to prove that there indeed exists a 2-dimensional Brownian motion (W+)+20 (W(1), W(2))+20 such that = S(1) S(2) = = S(¹) exp (011W(¹) + (μ₁ - 01/1) t) 롱) S(²) exp (021W (1) + 022W(2) + (112 - 03/01/12) t). where σ11, 21, 22 are constants to be determined (as functions of σ1, σ2, p). Hint: The constants will follow the formulas developed in the lectures. (a) To show existence of (Ŵ+), first write the expression for both W. (¹) and W (2) functions of (B(1), B(²)). as (b) Using the formulas obtained in (a), show that the process (WA) is actually a 2- dimensional standard Brownian motion (i.e. show that each component is normal, with mean 0, variance t, and that their…
The scores of 8 students on the midterm exam and final exam were as follows.   Student Midterm Final Anderson 98 89 Bailey 88 74 Cruz 87 97 DeSana 85 79 Erickson 85 94 Francis 83 71 Gray 74 98 Harris 70 91   Find the value of the (Spearman's) rank correlation coefficient test statistic that would be used to test the claim of no correlation between midterm score and final exam score. Round your answer to 3 places after the decimal point, if necessary. Test statistic: rs =

Chapter 11 Solutions

Mathematical Statistics with Applications

Ch. 11.3 - Some data obtained by C.E. Marcellari on the...Ch. 11.3 - Processors usually preserve cucumbers by...Ch. 11.3 - J. H. Matis and T. E. Wehrly report the following...Ch. 11.4 - a Derive the following identity:...Ch. 11.4 - An experiment was conducted to observe the effect...Ch. 11.4 - Prob. 17ECh. 11.4 - Prob. 18ECh. 11.4 - A study was conducted to determine the effects of...Ch. 11.4 - Suppose that Y1, Y2,,Yn are independent normal...Ch. 11.4 - Under the assumptions of Exercise 11.20, find...Ch. 11.4 - Prob. 22ECh. 11.5 - Use the properties of the least-squares estimators...Ch. 11.5 - Do the data in Exercise 11.19 present sufficient...Ch. 11.5 - Use the properties of the least-squares estimators...Ch. 11.5 - Let Y1, Y2, . . . , Yn be as given in Exercise...Ch. 11.5 - Prob. 30ECh. 11.5 - Using a chemical procedure called differential...Ch. 11.5 - Prob. 32ECh. 11.5 - Prob. 33ECh. 11.5 - Prob. 34ECh. 11.6 - For the simple linear regression model Y = 0 + 1x...Ch. 11.6 - Prob. 36ECh. 11.6 - Using the model fit to the data of Exercise 11.8,...Ch. 11.6 - Refer to Exercise 11.3. Find a 90% confidence...Ch. 11.6 - Refer to Exercise 11.16. Find a 95% confidence...Ch. 11.6 - Refer to Exercise 11.14. Find a 90% confidence...Ch. 11.6 - Prob. 41ECh. 11.7 - Suppose that the model Y=0+1+ is fit to the n data...Ch. 11.7 - Prob. 43ECh. 11.7 - Prob. 44ECh. 11.7 - Prob. 45ECh. 11.7 - Refer to Exercise 11.16. Find a 95% prediction...Ch. 11.7 - Refer to Exercise 11.14. Find a 95% prediction...Ch. 11.8 - The accompanying table gives the peak power load...Ch. 11.8 - Prob. 49ECh. 11.8 - Prob. 50ECh. 11.8 - Prob. 51ECh. 11.8 - Prob. 52ECh. 11.8 - Prob. 54ECh. 11.8 - Prob. 55ECh. 11.8 - Prob. 57ECh. 11.8 - Prob. 58ECh. 11.8 - Prob. 59ECh. 11.8 - Prob. 60ECh. 11.9 - Refer to Example 11.10. Find a 90% prediction...Ch. 11.9 - Prob. 62ECh. 11.9 - Prob. 63ECh. 11.9 - Prob. 64ECh. 11.9 - Prob. 65ECh. 11.10 - Refer to Exercise 11.3. Fit the model suggested...Ch. 11.10 - Prob. 67ECh. 11.10 - Fit the quadratic model Y=0+1x+2x2+ to the data...Ch. 11.10 - The manufacturer of Lexus automobiles has steadily...Ch. 11.10 - a Calculate SSE and S2 for Exercise 11.4. Use the...Ch. 11.12 - Consider the general linear model...Ch. 11.12 - Prob. 72ECh. 11.12 - Prob. 73ECh. 11.12 - An experiment was conducted to investigate the...Ch. 11.12 - Prob. 75ECh. 11.12 - The results that follow were obtained from an...Ch. 11.13 - Prob. 77ECh. 11.13 - Prob. 78ECh. 11.13 - Prob. 79ECh. 11.14 - Prob. 80ECh. 11.14 - Prob. 81ECh. 11.14 - Prob. 82ECh. 11.14 - Prob. 83ECh. 11.14 - Prob. 84ECh. 11.14 - Prob. 85ECh. 11.14 - Prob. 86ECh. 11.14 - Prob. 87ECh. 11.14 - Prob. 88ECh. 11.14 - Refer to the three models given in Exercise 11.88....Ch. 11.14 - Prob. 90ECh. 11.14 - Prob. 91ECh. 11.14 - Prob. 92ECh. 11.14 - Prob. 93ECh. 11.14 - Prob. 94ECh. 11 - At temperatures approaching absolute zero (273C),...Ch. 11 - A study was conducted to determine whether a...Ch. 11 - Prob. 97SECh. 11 - Prob. 98SECh. 11 - Prob. 99SECh. 11 - Prob. 100SECh. 11 - Prob. 102SECh. 11 - Prob. 103SECh. 11 - An experiment was conducted to determine the...Ch. 11 - Prob. 105SECh. 11 - Prob. 106SECh. 11 - Prob. 107SE
Knowledge Booster
Background pattern image
Statistics
Learn more about
Need a deep-dive on the concept behind this application? Look no further. Learn more about this topic, statistics and related others by exploring similar questions and additional content below.
Similar questions
SEE MORE QUESTIONS
Recommended textbooks for you
Text book image
Glencoe Algebra 1, Student Edition, 9780079039897...
Algebra
ISBN:9780079039897
Author:Carter
Publisher:McGraw Hill
Text book image
Holt Mcdougal Larson Pre-algebra: Student Edition...
Algebra
ISBN:9780547587776
Author:HOLT MCDOUGAL
Publisher:HOLT MCDOUGAL
Text book image
Big Ideas Math A Bridge To Success Algebra 1: Stu...
Algebra
ISBN:9781680331141
Author:HOUGHTON MIFFLIN HARCOURT
Publisher:Houghton Mifflin Harcourt
Text book image
College Algebra (MindTap Course List)
Algebra
ISBN:9781305652231
Author:R. David Gustafson, Jeff Hughes
Publisher:Cengage Learning
Text book image
Functions and Change: A Modeling Approach to Coll...
Algebra
ISBN:9781337111348
Author:Bruce Crauder, Benny Evans, Alan Noell
Publisher:Cengage Learning
Finding Local Maxima and Minima by Differentiation; Author: Professor Dave Explains;https://www.youtube.com/watch?v=pvLj1s7SOtk;License: Standard YouTube License, CC-BY