Concept explainers
Wilcoxon Signed-Rank Test for n > 30 When you are performing a Wilcoxon signed-rank test and the
In Exercises 9 and 10, perform the Wilcoxon signed-rank test using the test statistic for n > 30.
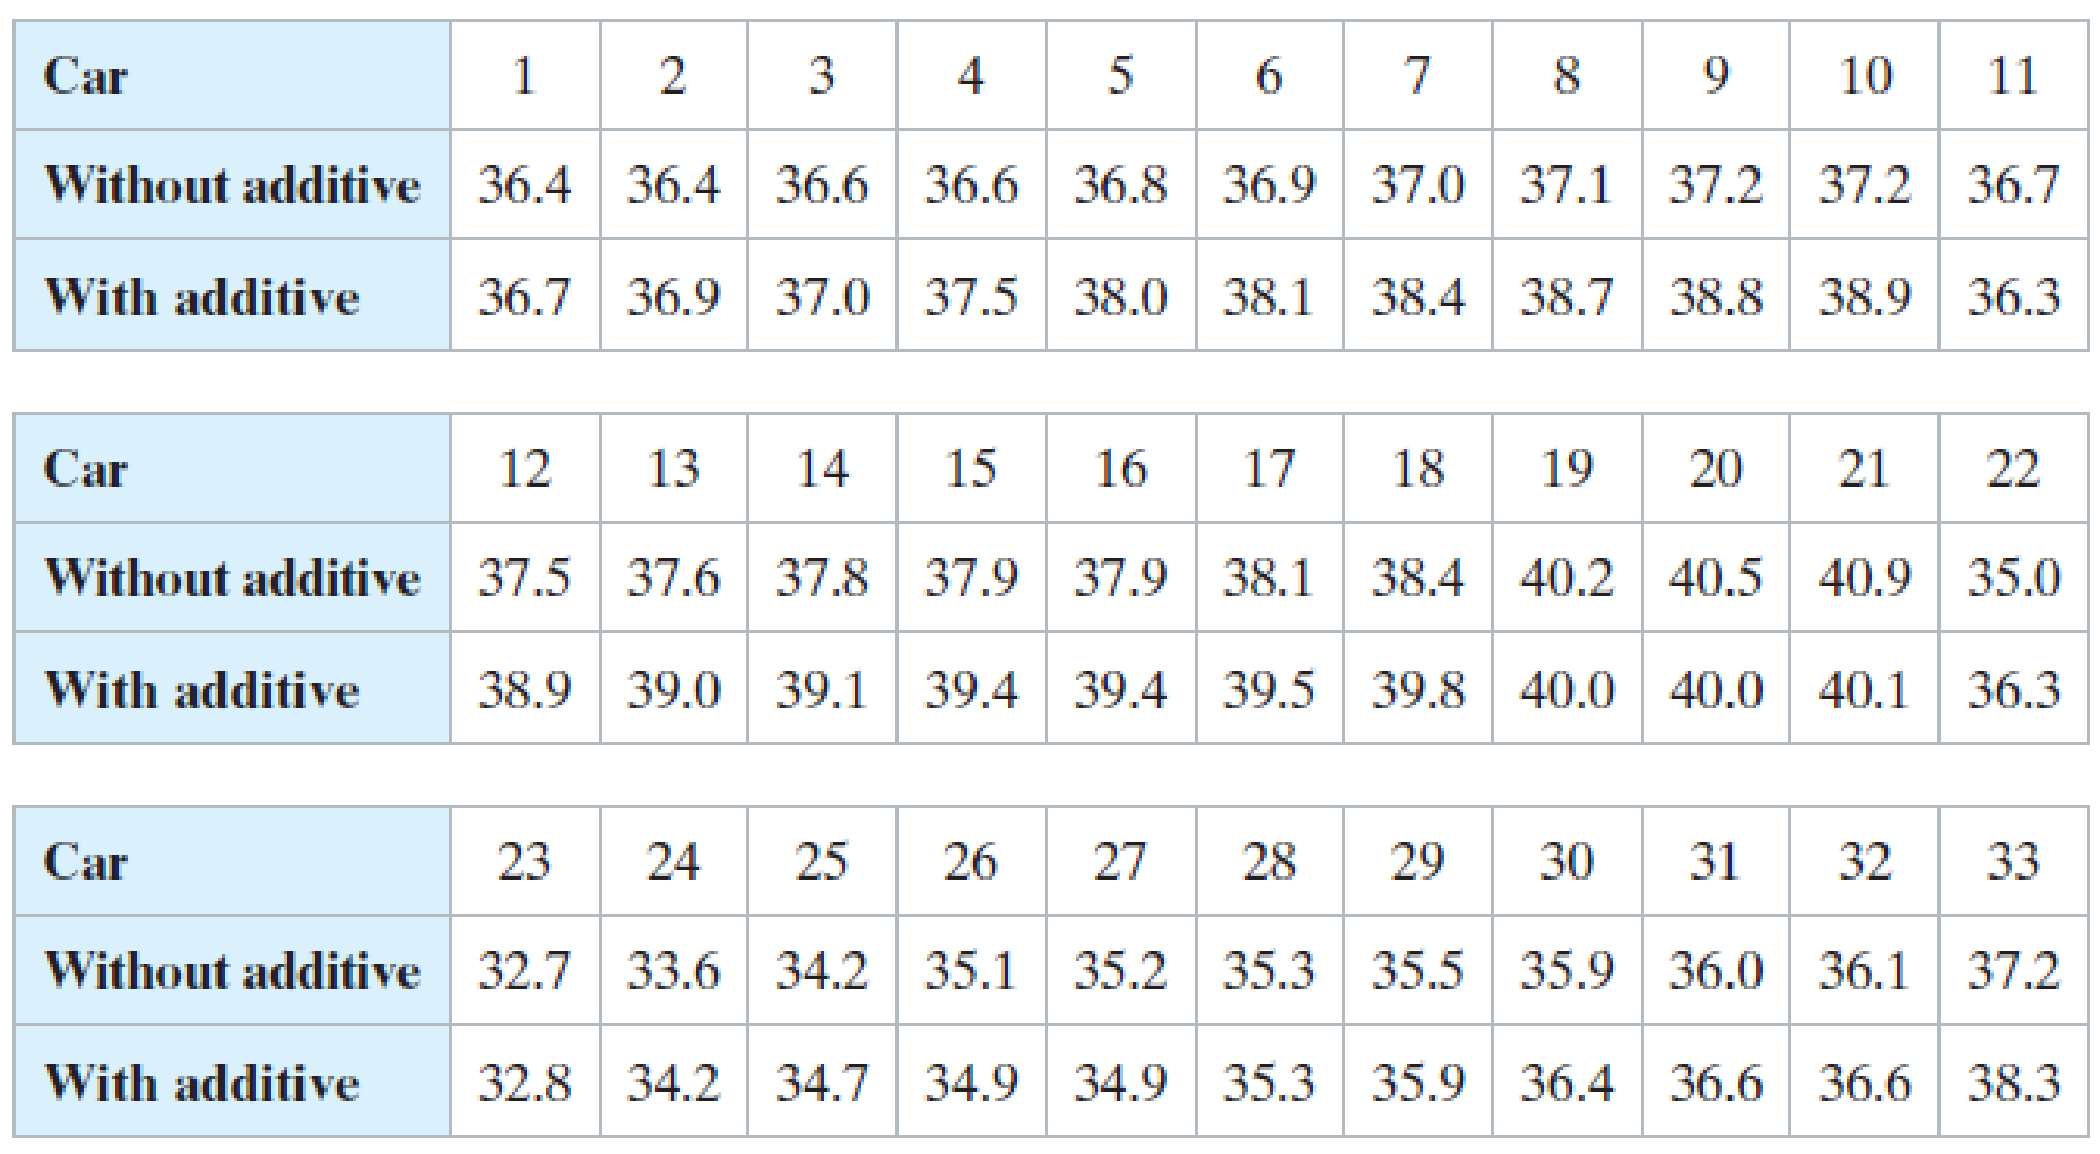
9. Fuel Additive A petroleum engineer wants to know whether a certain fuel additive improves a car’s gas mileage. To decide, the engineer records the gas mileages (in miles per gallon) of 33 randomly selected cars with and without the fuel additive. The table shows the results. At a = 0.10, can the engineer conclude that the gas mileage is improved?

Trending nowThis is a popular solution!

Chapter 11 Solutions
Elementary Statistics Books a la carte Plus NEW MyLab Statistics with Pearson eText - Access Card Package (6th Edition)
- For context, the images attached below are a question from a June, 2024 past paper in statistical modelingarrow_forwardFor context, the images attached below (question and related graph) are from a February 2024 past paper in statistical modelingarrow_forwardFor context, the images attached below are from a February 2024 past paper in statistical modelingarrow_forward
- For context, the image provided below is a question from a September, 2024 past paper in statistical modelingarrow_forwardFor context, the image below is from a January 2024 past paper in statistical modelingarrow_forwardFor context, the image provided below is a question from a September, 2024 past paper in statistical modelingarrow_forward
- Section 2.2 Subsets 71 Exercise Set 2.2 Practice Exercises In Exercises 1-18, write or in each blank so that the resulting statement is true. 1. {1, 2, 5} {1, 2, 3, 4, 5, 6, 7} 2. {2, 3, 7} {1, 2, 3, 4, 5, 6, 7} 3. {-3, 0, 3} {-4,-3,-1, 1, 3, 4} 4. {-4, 0, 4} 5. {Monday, Friday} {-3, -1, 1, 3} {Saturday, Sunday, Monday, Tuesday, Wednesday} 6. {Mercury, Venus, Earth} {Venus, Earth, Mars, Jupiter} 7. {x/x is a cat} {xx is a black cat} {x|x is a pure-bred dog} ibrary mbers, ause the entire sual 8. {xx is a dog} 9. (c, o, n, v, e, r, s, a, t, i, o, n} {v, o, i, c, e, s, r, a, n, t, o, n} 10. [r, e, v, o, l, u, t, i, o, n} {t, o, l, o, v, e, r, u, i, n} 33. A = {x|x E N and 5 < x < 12} B = {x|x E N and 2 ≤ x ≤ 11} A_ B 34. A = {x|x = N and 3 < x < 10} B = A. {x|x = N and 2 ≤ x ≤ 8} B 35. Ø {7, 8, 9,..., 100} 36. Ø _{101, 102, 103, . . ., 200} 37. [7, 8, 9,...} 38. [101, 102, 103, ...} 39. Ø 40. { } { } e In Exercises 41-54, determine whether each statement is true or false. If…arrow_forwardA = 5.8271 ± 0.1497 = B 1.77872 ± 0.01133 C=0.57729 ± 0.00908 1. Find the relative uncertainty of A, B, and C 2. Find A-3 3. Find 7B 4. Find A + B 5. Find A B-B - 6. Find A * B 7. Find C/B 8. Find 3/A 9. Find A 0.3B - 10. Find C/T 11. Find 1/√A 12. Find AB²arrow_forwardWhy charts,graphs,table??? difference between regression and correlation analysis.arrow_forward
- You’re scrolling through Instagram and you notice that a lot of people are posting selfies. This piques yourcuriosity and you want to estimate the percentage of photos on Instagram that are selfies.(a) (5 points) Is there a “ground truth” for the percentage of selfies on Instagram? Why or why not?(b) (5 points) Is it possible to estimate the ground truth percentage of selfies on Instagram?Irrespective of your answer to the previous question, you decide to pull up n = 250 randomly chosenphotos from your friends’ Instagram accounts and find that 32% of these photos are selfies.(c) (15 points) Determine which of the following is an observation, a variable, a sample statistic (valuecalculated based on the observed sample), or a population parameter.• A photo on Instagram.• Whether or not a photo is a selfie.• Percentage of all photos on Instagram that are selfies.• 32%.(d) (5 points) Based on the sample you collected, do you think 32% is a reliable ballpark estimate for theground truth…arrow_forwardCan you explain this statement below in layman's terms? Secondary Analysis with Generalized Linear Mixed Model with clustering for Hospital Center and ICUvs Ward EnrolmentIn a secondary adjusted analysis we used generalized linear mixed models with random effects forcenter (a stratification variable in the primary analyses). In this analysis, the relative risk for the primaryoutcome of 90-day mortality for 7 versus 14 days of antibiotics was 0.90 (95% Confidence Interval [CI]0.78, 1.05).arrow_forwardIn a crossover trial comparing a new drug to a standard, π denotes the probabilitythat the new one is judged better. It is desired to estimate π and test H0 : π = 0.5against H1 : π = 0.5. In 20 independent observations, the new drug is better eachtime.(a) Find and plot the likelihood function. Give the ML estimate of π (Hint: youmay use the plot function in R)arrow_forward
 Holt Mcdougal Larson Pre-algebra: Student Edition...AlgebraISBN:9780547587776Author:HOLT MCDOUGALPublisher:HOLT MCDOUGAL
 Functions and Change: A Modeling Approach to Coll...AlgebraISBN:9781337111348Author:Bruce Crauder, Benny Evans, Alan NoellPublisher:Cengage Learning


