
EP ELEMEN.STAT.-MYSTATLAB+ETEXT ACCESS
7th Edition
ISBN: 9780134683577
Author: Larson
Publisher: PEARSON CO
expand_more
expand_more
format_list_bulleted
Videos
Textbook Question
Chapter 11.2, Problem 7E
Performing a Wilcoxon Test In Exercises 3–8,
- (a) identify the claim and state H0 and Ha.
- (b) decide whether to use a Wilcoxon signed-rank test or a Wilcoxon rank sum test.
- (c) find the critical value(s).
- (d) find the test statistic.
- (e) decide whether to reject or fail to reject the null hypothesis.
- (f) interpret the decision in the context of the original claim.
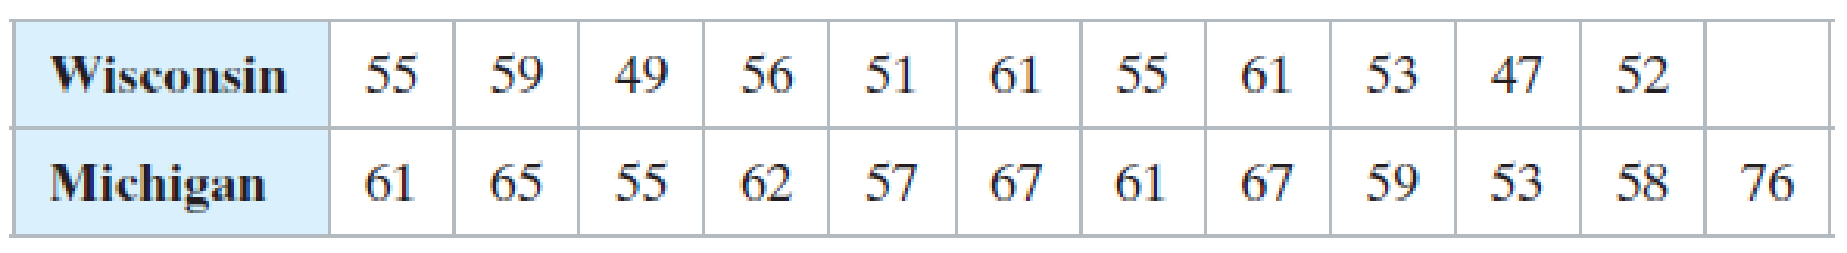
7. Teacher Salaries A teacher’s union representative claims that there is a difference in the salaries earned by teachers in Wisconsin and Michigan. The table shows the salaries (in thousands of dollars) of a random sample of 11 teachers from Wisconsin and 12 teachers from Michigan. At a = 0.05, is there enough evidence to support the representative’s claim? (Adapted from National Education Association)
Expert Solution & Answer
Want to see the full answer?
Check out a sample textbook solution
Students have asked these similar questions
A retail chain is interested in determining whether a digital video point-of-purchase (POP) display would stimulate higher sales for a brand advertised compared to the standard cardboard point-of-purchase display. To test this, a one-shot static group design experiment was conducted over a four-week period in 100 different stores. Fifty stores were randomly assigned to the control treatment (standard display) and the other 50 stores were randomly assigned to the experimental treatment (digital display). Compare the sales of the control group (standard POP) to the experimental group (digital POP).
What were the average sales for the standard POP display (control group)?
What were the sales for the digital display (experimental group)?
What is the (mean) difference in sales between the experimental group and control group?
List the null hypothesis being tested.
Do you reject or retain the null hypothesis based on the results of the independent t-test?
Was the difference between the…
Question 4
An article in Quality Progress (May 2011, pp. 42-48) describes the use of factorial experiments to improve a
silver powder production process. This product is used in conductive pastes to manufacture a wide variety of
products ranging from silicon wafers to elastic membrane switches. Powder density (g/cm²) and surface area
(cm/g) are the two critical characteristics of this product. The experiments involved three factors: reaction
temperature, ammonium percentage, stirring rate. Each of these factors had two levels, and the design was
replicated twice. The design is shown in Table 3.
A222222222222233
Stir Rate
(RPM)
Ammonium
(%)
Table 3: Silver Powder Experiment from Exercise 13.23
Temperature
(°C)
Density
Surface Area
100
8
14.68
0.40
100
8
15.18
0.43
30
100
8
15.12
0.42
30
100
17.48
0.41
150
7.54
0.69
150
8
6.66
0.67
30
150
8
12.46
0.52
30
150
8
12.62
0.36
100
40
10.95
0.58
100
40
17.68
0.43
30
100
40
12.65
0.57
30
100
40
15.96
0.54
150
40
8.03
0.68
150
40
8.84
0.75
30
150…
-
+
++
Table 2: Crack Experiment for Exercise 2
A B C D Treatment Combination
(1)
Replicate
I II
7.037
6.376
14.707 15.219
|++++ 1
བྱ॰༤༠སྦྱོ སྦྱོཋཏྟཱུ
a
b
ab
11.635 12.089
17.273 17.815
с
ас
10.403 10.151
4.368 4.098
bc
abc
9.360 9.253
13.440 12.923
d
8.561 8.951
ad
16.867 17.052
bd
13.876 13.658
abd
19.824 19.639
cd
11.846 12.337
acd
6.125
5.904
bcd
11.190 10.935
abcd
15.653 15.053
Question 3
Continuation of Exercise 2. One of the variables in the experiment described in Exercise 2, heat treatment
method (C), is a categorical variable. Assume that the remaining factors are continuous.
(a) Write two regression models for predicting crack length, one for each level of the heat treatment method
variable. What differences, if any, do you notice in these two equations?
(b) Generate appropriate response surface contour plots for the two regression models in part (a).
(c) What set of conditions would you recommend for the factors A, B, and D if you use heat treatment method
C = +?
(d) Repeat…
Chapter 11 Solutions
EP ELEMEN.STAT.-MYSTATLAB+ETEXT ACCESS
Ch. 11.1 - A real estate agency claims that the median number...Ch. 11.1 - An organization claims that the median age of...Ch. 11.1 - A medical researcher claims that a new vaccine...Ch. 11.1 - Prob. 1ECh. 11.1 - When the sign test is used, what population...Ch. 11.1 - Describe the test statistic for the sign test when...Ch. 11.1 - In your own words, explain why the hypothesis test...Ch. 11.1 - Explain how to use the sign test to test a...Ch. 11.1 - List the two conditions that must be met in order...Ch. 11.1 - Performing a Sign Test In Exercises 722, (a)...
Ch. 11.1 - Temperature A meteorologist claims that the median...Ch. 11.1 - Prob. 9ECh. 11.1 - Temperature During a weather report, a...Ch. 11.1 - Credit Card Debt A financial services institution...Ch. 11.1 - Financial Debt A financial services accountant...Ch. 11.1 - Prob. 13ECh. 11.1 - Social Networking A research group claims that the...Ch. 11.1 - Unit Size A renters organization claims that the...Ch. 11.1 - Prob. 16ECh. 11.1 - Hourly Wages A labor organization claims that the...Ch. 11.1 - Prob. 18ECh. 11.1 - Prob. 19ECh. 11.1 - Prob. 20ECh. 11.1 - Prob. 21ECh. 11.1 - Prob. 22ECh. 11.1 - Prob. 23ECh. 11.1 - Contacting Parents A research organization...Ch. 11.1 - In Exercises 2528, use a right-tailed test and (a)...Ch. 11.1 - Prob. 26ECh. 11.1 - Prob. 27ECh. 11.1 - Ages of Grooms A marriage counselor claims that...Ch. 11.2 - A quality control inspector wants to test the...Ch. 11.2 - Prob. 2TYCh. 11.2 - Prob. 1ECh. 11.2 - Prob. 2ECh. 11.2 - Prob. 3ECh. 11.2 - Prob. 4ECh. 11.2 - Prob. 5ECh. 11.2 - Prob. 6ECh. 11.2 - Performing a Wilcoxon Test In Exercises 38, (a)...Ch. 11.2 - Performing a Wilcoxon Test In Exercises 38, (a)...Ch. 11.2 - Wilcoxon Signed-Rank Test for n 30 When you are...Ch. 11.2 - Prob. 10ECh. 11.2 - Construct a side-by-side box-and-whisker plot for...Ch. 11.2 - Prob. 2CSCh. 11.2 - In Exercises 25, use the sign test to test the...Ch. 11.2 - In Exercises 25, use the sign test to test the...Ch. 11.2 - In Exercises 25, use the sign test to test the...Ch. 11.2 - In Exercises 6 and 7, use the Wilcoxon rank sum...Ch. 11.2 - In Exercises 6 and 7, use the Wilcoxon rank sum...Ch. 11.3 - Prob. 1TYCh. 11.3 - Prob. 1ECh. 11.3 - Explain why the Kruskal-Wallis test is always a...Ch. 11.3 - Prob. 3ECh. 11.3 - Performing a Kruskal-Wallis Test In Exercises 36,...Ch. 11.3 - Prob. 5ECh. 11.3 - Prob. 6ECh. 11.3 - Comparing Two Tests In Exercises 7 and 8, (a)...Ch. 11.3 - Comparing Two Tests In Exercises 7 and 8, (a)...Ch. 11.4 - Prob. 1TYCh. 11.4 - Prob. 1ECh. 11.4 - Prob. 2ECh. 11.4 - Prob. 3ECh. 11.4 - Prob. 4ECh. 11.4 - Prob. 5ECh. 11.4 - Prob. 6ECh. 11.4 - Prob. 7ECh. 11.4 - Prob. 8ECh. 11.4 - Prob. 9ECh. 11.4 - Prob. 10ECh. 11.4 - Prob. 11ECh. 11.4 - Prob. 12ECh. 11.4 - Prob. 13ECh. 11.4 - Prob. 14ECh. 11.5 - A machine produces engine parts. An inspector...Ch. 11.5 - Prob. 2TYCh. 11.5 - Prob. 3TYCh. 11.5 - In your own words, explain why the hypothesis test...Ch. 11.5 - Describe the test statistic for the runs test when...Ch. 11.5 - Finding the Number of Runs In Exercises 36,...Ch. 11.5 - Prob. 4ECh. 11.5 - Finding the Number of Runs In Exercises 36,...Ch. 11.5 - Prob. 6ECh. 11.5 - Prob. 7ECh. 11.5 - Prob. 8ECh. 11.5 - Prob. 9ECh. 11.5 - Prob. 10ECh. 11.5 - Finding Critical Values In Exercises 1114, use the...Ch. 11.5 - Prob. 12ECh. 11.5 - Prob. 13ECh. 11.5 - Prob. 14ECh. 11.5 - Prob. 15ECh. 11.5 - Prob. 16ECh. 11.5 - Prob. 17ECh. 11.5 - Prob. 18ECh. 11.5 - Prob. 19ECh. 11.5 - Prob. 20ECh. 11.5 - Prob. 21ECh. 11.5 - Prob. 22ECh. 11.5 - Runs Test with Quantitative Data In Exercises...Ch. 11 - Using an Inappropriate Test Discuss the...Ch. 11 - Prob. 11.1.1RECh. 11 - Prob. 11.1.2RECh. 11 - Prob. 11.1.3RECh. 11 - Prob. 11.1.4RECh. 11 - Prob. 11.1.5RECh. 11 - Prob. 11.1.6RECh. 11 - In Exercises 7 and 8, use a Wilcoxon test to test...Ch. 11 - In Exercises 7 and 8, use a Wilcoxon test to test...Ch. 11 - Prob. 11.3.9RECh. 11 - Prob. 11.3.10RECh. 11 - Prob. 11.4.11RECh. 11 - Prob. 11.4.12RECh. 11 - Prob. 11.5.13RECh. 11 - Prob. 11.5.14RECh. 11 - Prob. 1CQCh. 11 - Prob. 2CQCh. 11 - Prob. 3CQCh. 11 - Prob. 4CQCh. 11 - Prob. 5CQCh. 11 - Prob. 1CTCh. 11 - Prob. 2CTCh. 11 - Prob. 3CTCh. 11 - An employment agency claims that there is a...Ch. 11 - Prob. 5CTCh. 11 - How Would You Do It? (a) What sampling technique...Ch. 11 - In a recent year, according to the Bureau of Labor...Ch. 11 - Prob. 3RSRDCh. 11 - Construct a box-and-whisker plot for each region....Ch. 11 - In Exercises 15, refer to the annual incomes of...Ch. 11 - Use technology to perform a Wilcoxon rank sum test...Ch. 11 - Prob. 4TCh. 11 - Prob. 5TCh. 11 - Prob. 6T
Knowledge Booster


Learn more about
Need a deep-dive on the concept behind this application? Look no further. Learn more about this topic, statistics and related others by exploring similar questions and additional content below.Similar questions
- Question 2 A nickel-titanium alloy is used to make components for jet turbine aircraft engines. Cracking is a potentially serious problem in the final part because it can lead to nonrecoverable failure. A test is run at the parts producer to determine the effect of four factors on cracks. The four factors are: pouring temperature (A), titanium content (B), heat treatment method (C), amount of grain refiner used (D). Two replicates of a 24 design are run, and the length of crack (in mm x10-2) induced in a sample coupon subjected to a standard test is measured. The data are shown in Table 2. 1 (a) Estimate the factor effects. Which factor effects appear to be large? (b) Conduct an analysis of variance. Do any of the factors affect cracking? Use a = 0.05. (c) Write down a regression model that can be used to predict crack length as a function of the significant main effects and interactions you have identified in part (b). (d) Analyze the residuals from this experiment. (e) Is there an…arrow_forwardA 24-1 design has been used to investigate the effect of four factors on the resistivity of a silicon wafer. The data from this experiment are shown in Table 4. Table 4: Resistivity Experiment for Exercise 5 Run A B с D Resistivity 1 23 2 3 4 5 6 7 8 9 10 11 12 I+I+I+I+Oooo 0 0 ||++TI++o000 33.2 4.6 31.2 9.6 40.6 162.4 39.4 158.6 63.4 62.6 58.7 0 0 60.9 3 (a) Estimate the factor effects. Plot the effect estimates on a normal probability scale. (b) Identify a tentative model for this process. Fit the model and test for curvature. (c) Plot the residuals from the model in part (b) versus the predicted resistivity. Is there any indication on this plot of model inadequacy? (d) Construct a normal probability plot of the residuals. Is there any reason to doubt the validity of the normality assumption?arrow_forwardStem1: 1,4 Stem 2: 2,4,8 Stem3: 2,4 Stem4: 0,1,6,8 Stem5: 0,1,2,3,9 Stem 6: 2,2 What’s the Min,Q1, Med,Q3,Max?arrow_forward
- Are the t-statistics here greater than 1.96? What do you conclude? colgPA= 1.39+0.412 hsGPA (.33) (0.094) Find the P valuearrow_forwardA poll before the elections showed that in a given sample 79% of people vote for candidate C. How many people should be interviewed so that the pollsters can be 99% sure that from 75% to 83% of the population will vote for candidate C? Round your answer to the whole number.arrow_forwardSuppose a random sample of 459 married couples found that 307 had two or more personality preferences in common. In another random sample of 471 married couples, it was found that only 31 had no preferences in common. Let p1 be the population proportion of all married couples who have two or more personality preferences in common. Let p2 be the population proportion of all married couples who have no personality preferences in common. Find a95% confidence interval for . Round your answer to three decimal places.arrow_forward
- A history teacher interviewed a random sample of 80 students about their preferences in learning activities outside of school and whether they are considering watching a historical movie at the cinema. 69 answered that they would like to go to the cinema. Let p represent the proportion of students who want to watch a historical movie. Determine the maximal margin of error. Use α = 0.05. Round your answer to three decimal places. arrow_forwardA random sample of medical files is used to estimate the proportion p of all people who have blood type B. If you have no preliminary estimate for p, how many medical files should you include in a random sample in order to be 99% sure that the point estimate will be within a distance of 0.07 from p? Round your answer to the next higher whole number.arrow_forwardA clinical study is designed to assess the average length of hospital stay of patients who underwent surgery. A preliminary study of a random sample of 70 surgery patients’ records showed that the standard deviation of the lengths of stay of all surgery patients is 7.5 days. How large should a sample to estimate the desired mean to within 1 day at 95% confidence? Round your answer to the whole number.arrow_forward
- A clinical study is designed to assess the average length of hospital stay of patients who underwent surgery. A preliminary study of a random sample of 70 surgery patients’ records showed that the standard deviation of the lengths of stay of all surgery patients is 7.5 days. How large should a sample to estimate the desired mean to within 1 day at 95% confidence? Round your answer to the whole number.arrow_forwardIn the experiment a sample of subjects is drawn of people who have an elbow surgery. Each of the people included in the sample was interviewed about their health status and measurements were taken before and after surgery. Are the measurements before and after the operation independent or dependent samples?arrow_forwardiid 1. The CLT provides an approximate sampling distribution for the arithmetic average Ỹ of a random sample Y₁, . . ., Yn f(y). The parameters of the approximate sampling distribution depend on the mean and variance of the underlying random variables (i.e., the population mean and variance). The approximation can be written to emphasize this, using the expec- tation and variance of one of the random variables in the sample instead of the parameters μ, 02: YNEY, · (1 (EY,, varyi n For the following population distributions f, write the approximate distribution of the sample mean. (a) Exponential with rate ẞ: f(y) = ß exp{−ßy} 1 (b) Chi-square with degrees of freedom: f(y) = ( 4 ) 2 y = exp { — ½/ } г( (c) Poisson with rate λ: P(Y = y) = exp(-\} > y! y²arrow_forward
arrow_back_ios
SEE MORE QUESTIONS
arrow_forward_ios
Recommended textbooks for you
 Algebra & Trigonometry with Analytic GeometryAlgebraISBN:9781133382119Author:SwokowskiPublisher:Cengage
Algebra & Trigonometry with Analytic Geometry
Algebra
ISBN:9781133382119
Author:Swokowski
Publisher:Cengage
Hypothesis Testing using Confidence Interval Approach; Author: BUM2413 Applied Statistics UMP;https://www.youtube.com/watch?v=Hq1l3e9pLyY;License: Standard YouTube License, CC-BY
Hypothesis Testing - Difference of Two Means - Student's -Distribution & Normal Distribution; Author: The Organic Chemistry Tutor;https://www.youtube.com/watch?v=UcZwyzwWU7o;License: Standard Youtube License