Playing Bingo In Exercise 39-44, refer to the following information. When playing bingo, 75 balls are placed in a bin and balls are selected at random. Each ball is marked with a letter and number as indicated in the following chart . B 1 − 15 I 16 − 30 N 31 − 45 G 46 − 60 O 61 − 75 For example, there are balls marked B1, B2, upto B15; |16, |17, upto |30; and so on (see photo). Assuming one bingo ball is selected at random, determine 44. the odds m favor of it being G50.
Playing Bingo In Exercise 39-44, refer to the following information. When playing bingo, 75 balls are placed in a bin and balls are selected at random. Each ball is marked with a letter and number as indicated in the following chart . B 1 − 15 I 16 − 30 N 31 − 45 G 46 − 60 O 61 − 75 For example, there are balls marked B1, B2, upto B15; |16, |17, upto |30; and so on (see photo). Assuming one bingo ball is selected at random, determine 44. the odds m favor of it being G50.
Solution Summary: The author calculates the odds in favor of a randomly selected bingo ball being G50 from 75 bingo balls.
Playing BingoIn Exercise 39-44, refer to the following information. When playing bingo, 75 balls are placed in a bin and balls are selected at random. Each ball is marked with a letter and number as indicated in the following chart.
B
1
−
15
I
16
−
30
N
31
−
45
G
46
−
60
O
61
−
75
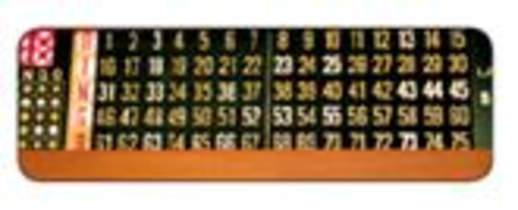
For example, there are balls marked B1, B2, upto B15; |16, |17, upto |30; and so on (see photo). Assuming one bingo ball is selected at random, determine
You may need to use the appropriate appendix table or technology to answer this question.
You are given the following information obtained from a random sample of 4 observations.
24
48
31
57
You want to determine whether or not the mean of the population from which this sample was taken is significantly different from 49. (Assume the population is normally distributed.)
(a)
State the null and the alternative hypotheses. (Enter != for ≠ as needed.)
H0:
Ha:
(b)
Determine the test statistic. (Round your answer to three decimal places.)
(c)
Determine the p-value, and at the 5% level of significance, test to determine whether or not the mean of the population is significantly different from 49.
Find the p-value. (Round your answer to four decimal places.)
p-value =
State your conclusion.
Reject H0. There is insufficient evidence to conclude that the mean of the population is different from 49.Do not reject H0. There is sufficient evidence to conclude that the…
Need a deep-dive on the concept behind this application? Look no further. Learn more about this topic, subject and related others by exploring similar questions and additional content below.
Discrete Distributions: Binomial, Poisson and Hypergeometric | Statistics for Data Science; Author: Dr. Bharatendra Rai;https://www.youtube.com/watch?v=lHhyy4JMigg;License: Standard Youtube License


 College Algebra (MindTap Course List)AlgebraISBN:9781305652231Author:R. David Gustafson, Jeff HughesPublisher:Cengage Learning
 Algebra & Trigonometry with Analytic GeometryAlgebraISBN:9781133382119Author:SwokowskiPublisher:Cengage
 Holt Mcdougal Larson Pre-algebra: Student Edition...AlgebraISBN:9780547587776Author:HOLT MCDOUGALPublisher:HOLT MCDOUGAL

 Algebra: Structure And Method, Book 1AlgebraISBN:9780395977224Author:Richard G. Brown, Mary P. Dolciani, Robert H. Sorgenfrey, William L. ColePublisher:McDougal Littell