
Videos
The accompanying data resulted from an experiment to investigate whether yield from a certain chemical process depended either on the formulation of a particular input or on mixer speed.
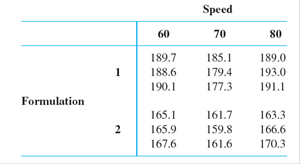
A statistical computer package gave SS(Form) = 2253.44, SS(Speed) = 230.81, SS(Form*Speed) = 18.58, and SSE = 71.87.
a. Does there appear to be interaction between the factors?
b. Does yield appear to depend on either formulation or speed?
c. Calculate estimates of the main effects.
d. The fitted values are
e. Construct a normal
a.
Identify whether there is a significant effect from interaction between speed and formulation.
Answer to Problem 18E
There is no sufficient evidence to conclude that there is an effect of interaction between mix speed and formulation on the chemical process.
Explanation of Solution
Given info:
An experiment was carried out to test the effect of formulation and speed on the chemical press. The formulation has two levels and speed has three levels.
The sum of squares due to formulation is 2,253.44, sum of squares due to speed is 230.81, sum of squares due to error is 71.87, sum of squares due to interaction between formulation and speed is 18.58.
Calculation:
Testing the Hypothesis:
Null hypothesis:
That is, the interaction effect between mix speed and formulation has no significant effect on chemical process.
Alternative hypothesis:
That is, the interaction effect between mix speed and formulation has no significant effect on chemical process.
Test statistic:
Software procedure:
Step by step procedure to find the test statistic using Minitab is given below:
- Choose Stat > ANOVA > General Linear Model.
- In Responses, enter the column of Chemical process.
- In Model, enter the column of Speed, Formulation, Speed*Formulation.
- In Results, choose “Analysis of variance table”.
- Click OK in all dialog boxes.
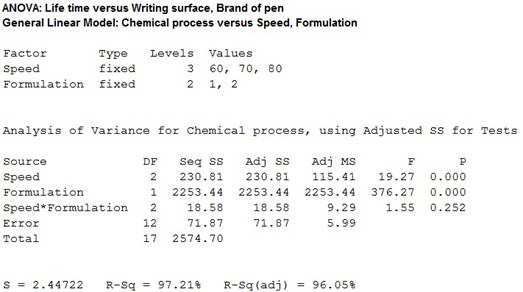
Output obtained from MINITAB is given below:
Conclusion:
Interaction effect of AB:
The P- value for the interaction effect AB is 0.252 and the level of significance is 0.01.
The P- value is lesser than the level of significance.
That is,
Thus, the null hypothesis is not rejected,
Hence, there is no sufficient evidence to conclude that there is an effect of interaction between mix speed and formulation on the chemical process.
b.
Identify whether the yield of the chemical process depends on speed or formulation.
Answer to Problem 18E
The yield of a chemical process depends on both speed and formulation.
Explanation of Solution
From the MINITAB output obtained in part (a), the following can be observed.
For Main effect of factor A speed:
The P- value for the factor A (speed) is 0.000 and the level of significance is 0.01.
The P- value is lesser than the level of significance.
That is,.
Thus, the null hypothesis is rejected,
Hence, there is sufficient evidence to conclude that there is an effect of speed on the yield of chemical process.
For Main effect of factor B formulation:
The P- value for the factor B (formulation) is 0.000 and the level of significance is 0.01.
The P- value is lesser than the level of significance.
That is,
Thus, the null hypothesis is rejected,
Hence, there is sufficient evidence to conclude that there is an effect of formulation on the yield of chemical process.
c.
Find the estimates for the main effects.
Explanation of Solution
Calculation:
Where,
Overall mean effect:
Mean due to the first level of factor A:
Mean due to the second level of factor A:
Main effect of factor A:
At first level:
At second level:
Mean due to the first level of factor B:
Mean due to the second level of factor B:
Mean due to the third level of factor B
Main effect of factor B:
d.
Verify whether the calculated residuals are equal to the given residual values.
Explanation of Solution
Calculation:
The interaction effect for the first level of factor A and the first level of factor B
The interaction effect for the first level of factor A and the second level of factor B
The interaction effect for the first level of factor A and the third level of factor B
Similarly, the remaining values are given below:
| S. No | Values |
| 1 | |
| 2 | |
| 3 | |
| 4 | |
| 5 | |
| 6 |
The fitted values are calculated by using the formula:
Where,
i represents the levels of factor A.
j represents the levels of factor B.
k represents the observation.
The predicted value when
Similarly, the other fitted values are calculated, the table shows the fitted values:
| S. No | 1 | 2 | 3 | 4 | 5 | 6 | 7 | 8 | 9 |
| Fitted values | 189.47 | 189.47 | 189.47 | 166.20 | 166.20 | 166.20 | 180.60 | 180.60 | 180.60 |
| S. No | 10 | 11 | 12 | 13 | 14 | 15 | 16 | 17 | 18 |
| Fitted values | 161.03 | 161.03 | 161.03 | 191.03 | 191.03 | 191.03 | 166.73 | 166.73 | 166.73 |
The residuals values are calculated by using the formula:
The table shows below gives the residuals for each observation:
| S. No |
Observed |
Fitted values | |
| 1 | 189.7 | 189.47 | 0.23 |
| 2 | 188.6 | 189.47 | –0.87 |
| 3 | 190.1 | 189.47 | 0.63 |
| 4 | 165.1 | 166.20 | –1.1 |
| 5 | 165.9 | 166.20 | –0.3 |
| 6 | 167.6 | 166.20 | 1.4 |
| 7 | 185.1 | 180.60 | 4.5 |
| 8 | 179.4 | 180.60 | –1.2 |
| 9 | 177.3 | 180.60 | –3.3 |
| 10 | 161.7 | 161.03 | 0.67 |
| 11 | 159.8 | 161.03 | –1.23 |
| 12 | 161.6 | 161.03 | 0.57 |
| 13 | 189 | 191.03 | –2.03 |
| 14 | 193 | 191.03 | 1.97 |
| 15 | 191.1 | 191.03 | 0.07 |
| 16 | 163.3 | 166.73 | –3.43 |
| 17 | 166.6 | 166.73 | –0.13 |
| 18 | 170.3 | 166.73 | 3.57 |
Hence, the calculated residuals values are equal to given residual values.
e.
Construct a normal probability plot for the residuals obtained in part (d).
Identify whether the residuals are normally distributed.
Answer to Problem 18E
The normal probability of residuals is given below:
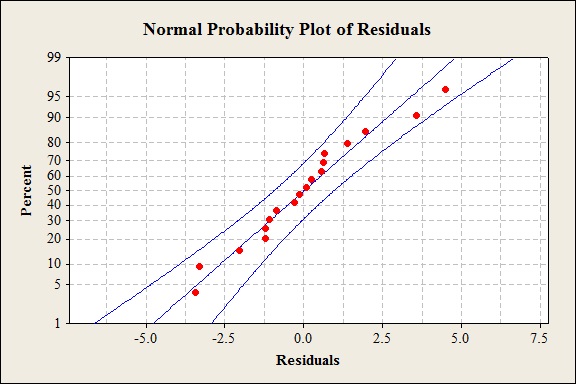
The residuals are normally distributed.
Explanation of Solution
Calculation:
Normal probability plot of residuals:
Software procedure:
Step-by-step procedure to construct a normal probability plot of residuals is given below:
- Click on Graph>Probability plot>Single.
- Click OK.
- Under Graph variables, select the column containing the residual values.
- Click on Distribution and selection Normal.
- Click OK.
Interpretation:
The normal probability plot of residuals suggests that the residuals are normally distributed because the residuals fall approximately on a straight line.
Want to see more full solutions like this?
Chapter 11 Solutions
Probability and Statistics for Engineering and the Sciences STAT 400 - University Of Maryland


- You want to make a salad from whatever vegetable you have in the fridge. You have seven different tomatoes. There are 2 red tomatoes, 4 yellow tomatoes, and one black tomato in the fridge. You have three different bell peppers. There is 1 red pepper, 1 yellow pepper, and 1 green pepper. What is the probability of randomly choosing a vegetable and getting a red tomato, and a green pepper? Round your answer to four decimal places.arrow_forwarduppose automobile insurance companies gave annual premiums for top-rated companies in several states. The figure below shows box plots for the annual premium for urban customers in three states. Which state offers the lowest premium? Which state offers the highest premium?arrow_forwardWing Foot is a shoe franchise commonly found in shopping centers across the United States. Wing Foot knows that its stores will not show a profit unless they gross over $940,000 per year. Let A be the event that a new Wing Foot store grosses over $940,000 its first year. Let B be the event that a store grosses over $940,000 its second year. Wing Foot has an administrative policy of closing a new store if it does not show a profit in either of the first two years. Assume that the accounting office at Wing Foot provided the following information: 58% of all Wing Foot stores show a profit the first year; 72% of all Wing Foot store show a profit the second year (this includes stores that did not show a profit the first year); however, 86% of Wing Foot stores that showed a profit the first year also showed a profit the second year. Compute P(B|Ac). Round your answer to the nearest hundredth.arrow_forward
- You draw two cards from a standard deck of 52 cards, but before you draw the second card, you put the first one back and reshuffle the deck. If you get a3on the first card, find the probability of drawing a 3 for the second card.arrow_forwardDo bonds reduce the overall risk of an investment portfolio? Let x be a random variable representing annual percent return for the Vanguard Total Stock Index (all Stocks). Let y be a random variable representing annual return for the Vanguard Balanced Index (60% stock and 40% bond). For the past several years, assume the following data. Compute the coefficient of variation for each fund. Round your answers to the nearest tenth. x: 14 0 37 21 35 23 24 -14 -14 -17 y: 8 -2 29 17 22 17 17 -2 -3 -8arrow_forwardWhat percentage of the general U.S. population have bachelor's degrees? Suppose that the Statistical Abstract of the United States, 120th Edition, gives the following percentage of bachelor’s degrees by state. For convenience, the data are sorted in increasing order. 17 18 18 18 19 20 20 20 21 21 21 21 21 22 22 22 22 22 23 23 24 24 24 24 24 25 25 25 25 26 26 26 26 26 26 27 27 27 28 28 28 29 29 31 31 32 32 34 35 38 Illinois has a bachelor's degree percentage rate of about 18%. Into what quartile does this rate fall?arrow_forward
- What percentage of the general U.S. population have bachelor's degrees? Suppose that the Statistical Abstract of the United States, 120th Edition, gives the following percentage of bachelor’s degrees by state. For convenience, the data are sorted in increasing order. 17 18 18 18 19 20 20 20 21 21 21 21 21 22 22 22 22 22 23 23 24 24 24 24 24 25 25 25 25 26 26 26 26 26 26 27 27 27 28 28 28 29 29 31 31 32 32 34 35 38 Illinois has a bachelor's degree percentage rate of about 18%. Into what quartile does this rate fall?arrow_forwardFind the range for the following sample data. x 23 17 11 30 27arrow_forwardDo bonds reduce the overall risk of an investment portfolio? Let x be a random variable representing annual percent return for the Vanguard Total Stock Index (all Stocks). Let y be a random variable representing annual return for the Vanguard Balanced Index (60% stock and 40% bond). For the past several years, assume the following data. Compute the sample mean for x and for y. Round your answer to the nearest tenth. x: 11 0 36 22 34 24 25 -11 -11 -22 y: 9 -3 28 14 23 16 14 -3 -4 -9arrow_forward
- Do bonds reduce the overall risk of an investment portfolio? Let x be a random variable representing annual percent return for the Vanguard Total Stock Index (all Stocks). Let y be a random variable representing annual return for the Vanguard Balanced Index (60% stock and 40% bond). For the past several years, assume the following data. Compute the range for variable y. X 12 0 36 21 35 23 24 -12 -12 -21 Y 10 -2 26 15 22 18 15 -2 -3 -10arrow_forwardDo bonds reduce the overall risk of an investment portfolio? Let x be a random variable representing annual percent return for the Vanguard Total Stock Index (all Stocks). Let y be a random variable representing annual return for the Vanguard Balanced Index (60% stock and 40% bond). For the past several years, assume the following data. Compute the range for variable y. X 12 0 36 21 35 23 24 -12 -12 -21 Y 10 -2 26 15 22 18 15 -2 -3 -10arrow_forwardDo bonds reduce the overall risk of an investment portfolio? Let x be a random variable representing annual percent return for the Vanguard Total Stock Index (all Stocks). Let y be a random variable representing annual return for the Vanguard Balanced Index (60% stock and 40% bond). For the past several years, assume the following data. Compute the range for variable x. X 15 0 37 23 33 25 26 -15 -15 -23 Y 6 -1 28 18 24 17 18 -1 -2 -6arrow_forward
 Big Ideas Math A Bridge To Success Algebra 1: Stu...AlgebraISBN:9781680331141Author:HOUGHTON MIFFLIN HARCOURTPublisher:Houghton Mifflin Harcourt
 Functions and Change: A Modeling Approach to Coll...AlgebraISBN:9781337111348Author:Bruce Crauder, Benny Evans, Alan NoellPublisher:Cengage Learning
 Glencoe Algebra 1, Student Edition, 9780079039897...AlgebraISBN:9780079039897Author:CarterPublisher:McGraw Hill
 Linear Algebra: A Modern IntroductionAlgebraISBN:9781285463247Author:David PoolePublisher:Cengage Learning
 Holt Mcdougal Larson Pre-algebra: Student Edition...AlgebraISBN:9780547587776Author:HOLT MCDOUGALPublisher:HOLT MCDOUGAL