Putting It Together: Glide Testing You are a passenger in a single-propeller-driven aircraft that experiences engine failure in the middle of a flight. The pilot wants to maximize the distance that the plane can glide to increase the likelihood of finding a safe place to land. To accomplish this goal should the pilot allow the propeller to “windmill” or should the pilot force the propeller to stop?
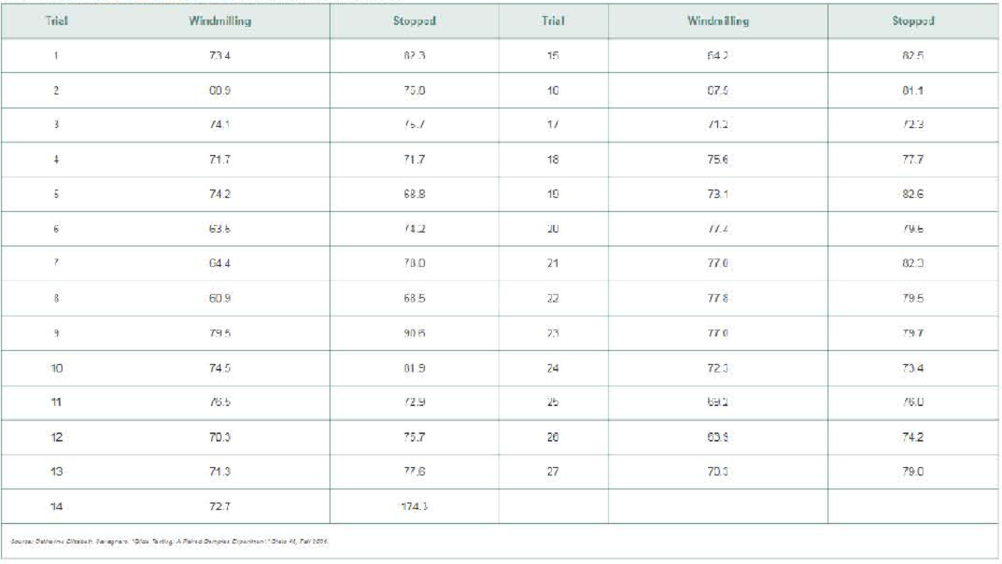
To obtain the data needed to answer the research question a pilot climbed to 8000 feet at a speed of 60 knots and then killed the engine with the propeller either windmilling or stopped. Because the time to descend is directly proportional to glide distance, the time to descend to 7200 feet was recorded in seconds and used as a proxy for glide distance. The design called for randomly choosing the order in which the propeller would windmill or be stopped. The data in the table represent the time to descend 800 feet for each of 27 trials.
Note: Visit www.aceaerobaticschool.com to see footage of this scenario

- a. The trials took place over the course of a few days. However, for each trial, the pilot conducted both windmilling and stopped propeller one right after the other to minimize any impact of a change in weather conditions. Knowing this, explain why this is matched-pair data.
- b. Why does the researcher randomly determine whether to windmill or stop the propeller first for each trial?
- c. Explain why blinding is not possible for this experiment.
- d. What is the response variable in the study? What are the treatments?
- e. Compute the difference as “difference = stopped − windmilling.” Draw a boxplot of the differenced data. What do you notice?
- a. From part (e), you should notice that trial 14 results in an outlier. Because our sample size is small, this outlier will have a major effect on any results. The author of the article indicated that it was possibly a situation in which there was an updraft of wind, causing the plane to take quite a bit longer than normal to fall 800 feet. Explain why this explanation makes it reasonable to eliminate trial 14 from the analysis.
- b. Redraw a boxplot of the data with trial 14 eliminated. Based on the shape of the boxplot, do you believe it is reasonable to proceed with a matched-pair t-test?
- c. The researchers wanted to determine if stopping the propeller resulted in a longer glide distance. Based on this goal, determine the null and alternative hypotheses.
- d. Conduct the appropriate test to answer the researcher’s question.
- e. Write a few sentences outlining your recommendations to pilots who experience engine failure.
Want to see the full answer?
Check out a sample textbook solution
Chapter 11 Solutions
Fundamentals of Statistics Plus MyLab Statistics with Pearson eText - Title-Specific Access Card Package (5th Edition)
- A company found that the daily sales revenue of its flagship product follows a normal distribution with a mean of $4500 and a standard deviation of $450. The company defines a "high-sales day" that is, any day with sales exceeding $4800. please provide a step by step on how to get the answers in excel Q: What percentage of days can the company expect to have "high-sales days" or sales greater than $4800? Q: What is the sales revenue threshold for the bottom 10% of days? (please note that 10% refers to the probability/area under bell curve towards the lower tail of bell curve) Provide answers in the yellow cellsarrow_forwardFind the critical value for a left-tailed test using the F distribution with a 0.025, degrees of freedom in the numerator=12, and degrees of freedom in the denominator = 50. A portion of the table of critical values of the F-distribution is provided. Click the icon to view the partial table of critical values of the F-distribution. What is the critical value? (Round to two decimal places as needed.)arrow_forwardA retail store manager claims that the average daily sales of the store are $1,500. You aim to test whether the actual average daily sales differ significantly from this claimed value. You can provide your answer by inserting a text box and the answer must include: Null hypothesis, Alternative hypothesis, Show answer (output table/summary table), and Conclusion based on the P value. Showing the calculation is a must. If calculation is missing,so please provide a step by step on the answers Numerical answers in the yellow cellsarrow_forward
- Algebra & Trigonometry with Analytic GeometryAlgebraISBN:9781133382119Author:SwokowskiPublisher:Cengage
 Glencoe Algebra 1, Student Edition, 9780079039897...AlgebraISBN:9780079039897Author:CarterPublisher:McGraw Hill
 Trigonometry (MindTap Course List)TrigonometryISBN:9781305652224Author:Charles P. McKeague, Mark D. TurnerPublisher:Cengage Learning
  Elementary AlgebraAlgebraISBN:9780998625713Author:Lynn Marecek, MaryAnne Anthony-SmithPublisher:OpenStax - Rice University
 Trigonometry (MindTap Course List)TrigonometryISBN:9781337278461Author:Ron LarsonPublisher:Cengage Learning


