
Concept explainers
Videos
Dr. Penelope Nicholls is interested in exploring a possible connection between high plasma homocysteine (a toxic amino acid created by the body as it metabolizes protein) levels and cardiac hypertrophy (enlargement of the heart) in humans. Because there are many complex relationships among human characteristics, it will be difficult to answer her research question due to a significant risk that confounding factors will cloud her inferences. She wants to be sure that any differences in cardiac hypertrophy are due to high plasma homocysteine levels and not to other factors. Consequently, she needs to design her experiment carefully so that she controls lurking variables to the extent possible. Therefore, she decides to design a two-sample experiment with independent sampling: one group will be the experimental group, the other a control group. Knowing that many factors can affect the degree of cardiac hypertrophy (the response variable), Dr. Nicholls controls these factors by randomly assigning the experimental units to the experimental or control group. She hopes the randomization will result in both groups having similar characteristics.
In her preliminary literature review, Dr. Nicholls uncovered an article in which the authors hypothesized that there might be a relationship between high plasma homocysteine levels in patients with end-stage renal disease (ESRD) and cardiac hypertrophy. She has asked you, as her assistant, to review this article.
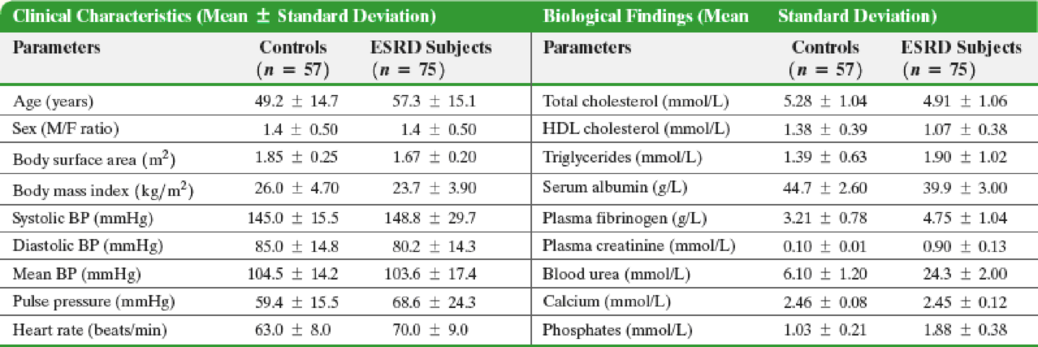
Upon reading the article, you discover that the authors used a nonrandom process to select a control group and an ESRD group. The researchers enlisted 75 stable ESRD patients into their study, all on hemodialysis for between 6 and 312 months. The control group subjects were chosen so as to eliminate any intergroup differences in terms of mean blood pressure (BP) and gender. In an effort to minimize situational contaminants, all physical and biochemical measurements were made after an overnight fast. The results for the control and ESRD groups are reproduced in the tables below.
3. Detail any assumptions and the rationale behind making them that you made while carrying out your analysis. Is there any additional information that you would like to have? Explain. Are there any additional statistical procedures that you think might be useful for analyzing these data? Explain.
Want to see the full answer?
Check out a sample textbook solution
Chapter 11 Solutions
Fundamentals of Statistics Plus MyLab Statistics with Pearson eText - Title-Specific Access Card Package (5th Edition)


- A company found that the daily sales revenue of its flagship product follows a normal distribution with a mean of $4500 and a standard deviation of $450. The company defines a "high-sales day" that is, any day with sales exceeding $4800. please provide a step by step on how to get the answers in excel Q: What percentage of days can the company expect to have "high-sales days" or sales greater than $4800? Q: What is the sales revenue threshold for the bottom 10% of days? (please note that 10% refers to the probability/area under bell curve towards the lower tail of bell curve) Provide answers in the yellow cellsarrow_forwardFind the critical value for a left-tailed test using the F distribution with a 0.025, degrees of freedom in the numerator=12, and degrees of freedom in the denominator = 50. A portion of the table of critical values of the F-distribution is provided. Click the icon to view the partial table of critical values of the F-distribution. What is the critical value? (Round to two decimal places as needed.)arrow_forwardA retail store manager claims that the average daily sales of the store are $1,500. You aim to test whether the actual average daily sales differ significantly from this claimed value. You can provide your answer by inserting a text box and the answer must include: Null hypothesis, Alternative hypothesis, Show answer (output table/summary table), and Conclusion based on the P value. Showing the calculation is a must. If calculation is missing,so please provide a step by step on the answers Numerical answers in the yellow cellsarrow_forward
 Big Ideas Math A Bridge To Success Algebra 1: Stu...AlgebraISBN:9781680331141Author:HOUGHTON MIFFLIN HARCOURTPublisher:Houghton Mifflin Harcourt
 Glencoe Algebra 1, Student Edition, 9780079039897...AlgebraISBN:9780079039897Author:CarterPublisher:McGraw Hill
 Linear Algebra: A Modern IntroductionAlgebraISBN:9781285463247Author:David PoolePublisher:Cengage Learning