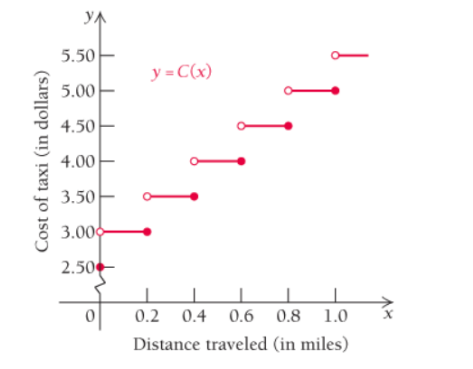
Taxicab fares. In New York City, taxicabs change passengers $2.50 for entering a cab and then $050 for each one-fifth of a mile (or fraction thereof) traveled. (There are additional charge for slow traffic and idle times, but these are not considered in this problem.) If x presents the distance traveled in miles, then C ( x ) is the cost of the taxi fare, where C ( x ) = $ 2.50 , if x = 0 , C ( x ) = $ 3.00 , if 0 < x ≤ 0.2 , C ( x ) = $ 3.50 , if 0.2 < x ≤ 0.4 , C ( x ) = $ 4.00 , if 0.4 < x ≤ 0.6 , and so on. The graph of C is show below. (Source; New York City Taxi and Limousine Commission.) Using the graph of the taxicab fare function, find each of the following limits. if it exists. lim x → 0.6 − C ( x ) , lim x → 0.6 + C ( x ) , lim x → 0.6 C ( x )
Taxicab fares. In New York City, taxicabs change passengers $2.50 for entering a cab and then $050 for each one-fifth of a mile (or fraction thereof) traveled. (There are additional charge for slow traffic and idle times, but these are not considered in this problem.) If x presents the distance traveled in miles, then C ( x ) is the cost of the taxi fare, where C ( x ) = $ 2.50 , if x = 0 , C ( x ) = $ 3.00 , if 0 < x ≤ 0.2 , C ( x ) = $ 3.50 , if 0.2 < x ≤ 0.4 , C ( x ) = $ 4.00 , if 0.4 < x ≤ 0.6 , and so on. The graph of C is show below. (Source; New York City Taxi and Limousine Commission.) Using the graph of the taxicab fare function, find each of the following limits. if it exists. lim x → 0.6 − C ( x ) , lim x → 0.6 + C ( x ) , lim x → 0.6 C ( x )
Taxicab fares. In New York City, taxicabs change passengers $2.50 for entering a cab and then $050 for each one-fifth of a mile (or fraction thereof) traveled. (There are additional charge for slow traffic and idle times, but these are not considered in this problem.) If x presents the distance traveled in miles, then
C
(
x
)
is the cost of the taxi fare, where
C
(
x
)
=
$
2.50
,
if
x
=
0
,
C
(
x
)
=
$
3.00
,
if
0
<
x
≤
0.2
,
C
(
x
)
=
$
3.50
,
if
0.2
<
x
≤
0.4
,
C
(
x
)
=
$
4.00
,
if
0.4
<
x
≤
0.6
,
and so on. The graph of C is show below. (Source; New York City Taxi and Limousine Commission.)
Using the graph of the taxicab fare function, find each of the following limits. if it exists.
lim
x
→
0.6
−
C
(
x
)
,
lim
x
→
0.6
+
C
(
x
)
,
lim
x
→
0.6
C
(
x
)
There are three options for investing $1150. The first earns 10% compounded annually, the second earns 10% compounded quarterly, and the third earns 10% compounded continuously. Find equations that model each investment growth and
use a graphing utility to graph each model in the same viewing window over a 20-year period. Use the graph to determine which investment yields the highest return after 20 years. What are the differences in earnings among the three
investment?
STEP 1: The formula for compound interest is
A =
nt
= P(1 + − − ) n²,
where n is the number of compoundings per year, t is the number of years, r is the interest rate, P is the principal, and A is the amount (balance) after t years. For continuous compounding, the formula reduces to
A = Pert
Find r and n for each model, and use these values to write A in terms of t for each case.
Annual Model
r=0.10
A = Y(t) = 1150 (1.10)*
n = 1
Quarterly Model
r = 0.10
n = 4
A = Q(t) = 1150(1.025) 4t
Continuous Model
r=0.10
A = C(t) =…
Use a graphing utility to find the point of intersection, if any, of the graphs of the functions. Round your result to three decimal places. (Enter NONE in any unused answer blanks.)
y = 100e0.01x
(x, y) =
y = 11,250
×
5. For the function y-x³-3x²-1, use
derivatives to:
(a) determine the intervals of increase and
decrease.
(b) determine the local (relative) maxima and
minima.
(e) determine the intervals of concavity.
(d) determine the points of inflection.
(e) sketch the graph with the above information
indicated on the graph.
Need a deep-dive on the concept behind this application? Look no further. Learn more about this topic, calculus and related others by exploring similar questions and additional content below.


 Algebra: Structure And Method, Book 1AlgebraISBN:9780395977224Author:Richard G. Brown, Mary P. Dolciani, Robert H. Sorgenfrey, William L. ColePublisher:McDougal Littell
 Algebra & Trigonometry with Analytic GeometryAlgebraISBN:9781133382119Author:SwokowskiPublisher:Cengage
 College Algebra (MindTap Course List)AlgebraISBN:9781305652231Author:R. David Gustafson, Jeff HughesPublisher:Cengage Learning
 Big Ideas Math A Bridge To Success Algebra 1: Stu...AlgebraISBN:9781680331141Author:HOUGHTON MIFFLIN HARCOURTPublisher:Houghton Mifflin Harcourt
 Algebra and Trigonometry (MindTap Course List)AlgebraISBN:9781305071742Author:James Stewart, Lothar Redlin, Saleem WatsonPublisher:Cengage Learning