The Postage function. The cost of sending a large envelope via U.S. first-class mail in 2014 was $0.98 for the first ounce and $0.21 for each additional ounce (or fraction thereof). (Source; www.usps.com .) If x represents the weight of a large envelope, in ounces, then p ( x ) is the cost of mailing it, where p ( x ) = $ 0.98 , if 0 < x ≤ 1 , p ( x ) = $ 1.19 , if 1 < x ≤ 2 , p ( x ) = $ 1.40 , if 2 < x ≤ 3 , And so on, up through 13 ounce. The graph of p is show below. Using the graph of the postage function, find each of the following limit, if it exists. lim x → 2.6 − p ( x ) , lim x → 2.6 + p ( x ) , lim x → 2.6 p ( x )
The Postage function. The cost of sending a large envelope via U.S. first-class mail in 2014 was $0.98 for the first ounce and $0.21 for each additional ounce (or fraction thereof). (Source; www.usps.com .) If x represents the weight of a large envelope, in ounces, then p ( x ) is the cost of mailing it, where p ( x ) = $ 0.98 , if 0 < x ≤ 1 , p ( x ) = $ 1.19 , if 1 < x ≤ 2 , p ( x ) = $ 1.40 , if 2 < x ≤ 3 , And so on, up through 13 ounce. The graph of p is show below. Using the graph of the postage function, find each of the following limit, if it exists. lim x → 2.6 − p ( x ) , lim x → 2.6 + p ( x ) , lim x → 2.6 p ( x )
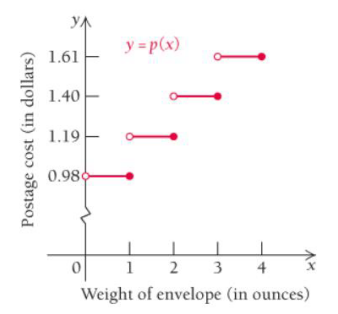
The cost of sending a large envelope via U.S. first-class mail in 2014 was $0.98 for the first ounce and $0.21 for each additional ounce (or fraction thereof). (Source; www.usps.com.) If x represents the weight of a large envelope, in ounces, then
p
(
x
)
is the cost of mailing it, where
p
(
x
)
=
$
0.98
,
if
0
<
x
≤
1
,
p
(
x
)
=
$
1.19
,
if
1
<
x
≤
2
,
p
(
x
)
=
$
1.40
,
if
2
<
x
≤
3
,
And so on, up through 13 ounce. The graph of p is show below.
Using the graph of the postage function, find each of the following limit, if it exists.
lim
x
→
2.6
−
p
(
x
)
,
lim
x
→
2.6
+
p
(
x
)
,
lim
x
→
2.6
p
(
x
)
Consider the function f(x) = x²-1.
(a) Find the instantaneous rate of change of f(x) at x=1 using the definition of the derivative.
Show all your steps clearly.
(b) Sketch the graph of f(x) around x = 1. Draw the secant line passing through the points on the
graph where x 1 and x->
1+h (for a small positive value of h, illustrate conceptually). Then,
draw the tangent line to the graph at x=1. Explain how the slope of the tangent line relates to the
value you found in part (a).
(c) In a few sentences, explain what the instantaneous rate of change of f(x) at x = 1 represents in
the context of the graph of f(x). How does the rate of change of this function vary at different
points?
1. The graph of ƒ is given. Use the graph to evaluate each of the following values. If a value does not exist,
state that fact.
и
(a) f'(-5)
(b) f'(-3)
(c) f'(0)
(d) f'(5)
2. Find an equation of the tangent line to the graph of y = g(x) at x = 5 if g(5) = −3 and g'(5)
=
4.
-
3. If an equation of the tangent line to the graph of y = f(x) at the point where x 2 is y = 4x — 5, find ƒ(2)
and f'(2).
Does the series converge or diverge
Chapter 1 Solutions
Calculus and Its Applications, Books a la Carte Plus MyLab Math Access Card Package (11th Edition)
Need a deep-dive on the concept behind this application? Look no further. Learn more about this topic, calculus and related others by exploring similar questions and additional content below.


 College AlgebraAlgebraISBN:9781305115545Author:James Stewart, Lothar Redlin, Saleem WatsonPublisher:Cengage Learning
 Functions and Change: A Modeling Approach to Coll...AlgebraISBN:9781337111348Author:Bruce Crauder, Benny Evans, Alan NoellPublisher:Cengage Learning
 Intermediate AlgebraAlgebraISBN:9781285195728Author:Jerome E. Kaufmann, Karen L. SchwittersPublisher:Cengage Learning
 Glencoe Algebra 1, Student Edition, 9780079039897...AlgebraISBN:9780079039897Author:CarterPublisher:McGraw Hill
 Algebra: Structure And Method, Book 1AlgebraISBN:9780395977224Author:Richard G. Brown, Mary P. Dolciani, Robert H. Sorgenfrey, William L. ColePublisher:McDougal Littell