
Introductory Statistics
1st Edition
ISBN: 9781938168208
Author: Barbara Illowsky, Susan Dean
Publisher: OpenStax College
expand_more
expand_more
format_list_bulleted
Concept explainers
Videos
Textbook Question
Chapter 11, Problem 5P
Is it more likely the df is 90, 20, or two in the graph?
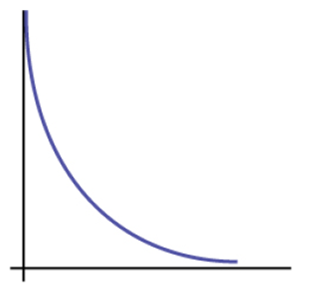
Figure 11.13
Expert Solution & Answer
Want to see the full answer?
Check out a sample textbook solution
Students have asked these similar questions
A smallish urn contains 25 small plastic bunnies – 7 of which are pink and 18 of which are white. 10 bunnies are drawn from the urn at random with replacement, and X is the number of pink bunnies that are drawn.
(a) P(X = 5) ≈
(b) P(X<6) ≈
The Whoville small urn contains 100 marbles – 60 blue and 40 orange. The Grinch sneaks in one night and grabs a simple random sample (without replacement) of 15 marbles.
(a) The probability that the Grinch gets exactly 6 blue marbles is [ Select ] ["≈ 0.054", "≈ 0.043", "≈ 0.061"] .
(b) The probability that the Grinch gets at least 7 blue marbles is [ Select ] ["≈ 0.922", "≈ 0.905", "≈ 0.893"] .
(c) The probability that the Grinch gets between 8 and 12 blue marbles (inclusive) is [ Select ] ["≈ 0.801", "≈ 0.760", "≈ 0.786"] . The Whoville small urn contains 100 marbles – 60 blue and 40 orange. The Grinch sneaks in one night and grabs a simple random sample (without replacement) of 15 marbles.
(a)…
Suppose an experiment was conducted to compare the mileage(km) per litre
obtained by competing brands of petrol I,II,III. Three new Mazda, three new
Toyota and three new Nissan cars were available for experimentation. During the
experiment the cars would operate under same conditions in order to eliminate
the effect of external variables on the distance travelled per litre on the assigned
brand of petrol. The data is given as below:
Brands of Petrol Mazda Toyota Nissan
I 10.6 12.0 11.0
II 9.0 15.0 12.0
III 12.0 17.4 13.0
(a) Test at the 5% level of significance whether there are signi
cant differences among the brands of fuels and also among the cars. [10]
(b) Compute the standard error for comparing any two fuel brands means. Hence
compare, at the 5% level of significance, each of fuel brands II, and III with
the standard fuel brand I. [10] �
Business discuss
Chapter 11 Solutions
Introductory Statistics
Ch. 11 - A factory manager needs to understand how many...Ch. 11 - Teachers want to know which night each week their...Ch. 11 - The expected percentage of the number of pets...Ch. 11 - Students in a social studies class hypothesize...Ch. 11 - A sample of 300 students is taken. Of the students...Ch. 11 - The Bureau of Labor Statistics gathers data about...Ch. 11 - Refer back to the information in Try It. How many...Ch. 11 - Do families and singles have the same distribution...Ch. 11 - Ivy League schools receive many applications, but...Ch. 11 - A SCUBA instructor wants to record the collective...
Ch. 11 - The FCC conducts broadband speed tests to measure...Ch. 11 - If the number of degrees of freedom for a...Ch. 11 - If df > 90, the distribution is _____________. If...Ch. 11 - When does the chi-square curve approximate a...Ch. 11 - Where is µ located on a chi-square curve?Ch. 11 - Is it more likely the df is 90, 20, or two in the...Ch. 11 - Determine the appropriate test to be used in the...Ch. 11 - Determine the appropriate test to be used in the...Ch. 11 - Determine the appropriate test to be used in the...Ch. 11 - Use the following information to answer the next...Ch. 11 - Use the following information to answer the next...Ch. 11 - x2test statistic = ______. Use the following...Ch. 11 - Use the following information to answer the next...Ch. 11 - Use the following information to answer the next...Ch. 11 - Use the following information to answer the next...Ch. 11 - Use the following information to answer the next...Ch. 11 - Use the following information to answer the next...Ch. 11 - Use the following information to answer the next...Ch. 11 - Use the following information to answer the next...Ch. 11 - Use the following information to answer the next...Ch. 11 - Use the following information to answer the next...Ch. 11 - Use the following information to answer the next...Ch. 11 - Use the following information to answer the next...Ch. 11 - Test of Independence Determine the appropriate...Ch. 11 - Test of Independence Determine the appropriate...Ch. 11 - Test of Independence Determine the appropriate...Ch. 11 - Use the following information to answer the next...Ch. 11 - Use the following information to answer the next...Ch. 11 - Use the following information to answer the next...Ch. 11 - Use the following information to answer the next...Ch. 11 - Use the following information to answer the next...Ch. 11 - Use the following information to answer the next...Ch. 11 - Use the following information to answer the next...Ch. 11 - Use the following information to answer the next...Ch. 11 - Use the following information to answer the next...Ch. 11 - Use the following information to answer the next...Ch. 11 - Use the following information to answer the next...Ch. 11 - Use the following information to answer the next...Ch. 11 - Use the following information to answer the next...Ch. 11 - Use the following information to answer the next...Ch. 11 - Use the following information to answer the next...Ch. 11 - a = 0.05 a. Decision: ___________________ b....Ch. 11 - a = 0.01 a. Decision: ___________________ b....Ch. 11 - A math teacher wants to see if two of her classes...Ch. 11 - What are the null and alternative hypotheses for...Ch. 11 - A market researcher wants to see if two different...Ch. 11 - A meteorologist wants to know if East and West...Ch. 11 - What condition must be met to use the test for...Ch. 11 - Use the following information to answer the next...Ch. 11 - Use the following information to answer the next...Ch. 11 - Use the following information to answer the next...Ch. 11 - Use the following information to answer the next...Ch. 11 - Use the following information to answer the next...Ch. 11 - Which test do you use to decide whether an...Ch. 11 - What is the null hypothesis for the type of test...Ch. 11 - Which test would you use to decide whether two...Ch. 11 - Which test would you use to decide if two...Ch. 11 - How are tests of independence similar to tests for...Ch. 11 - How are tests of independence different from tests...Ch. 11 - Test of a Single Variance Use the following...Ch. 11 - Test of a Single Variance Use the following...Ch. 11 - Test of a Single Variance Use the following...Ch. 11 - Use the following information to answer the next...Ch. 11 - Use the following information to answer the next...Ch. 11 - Use the following information to answer the next...Ch. 11 - Use the following information to answer the next...Ch. 11 - Use the following information to answer the next...Ch. 11 - Use the following information to answer the next...Ch. 11 - Use the following information to answer the next...Ch. 11 - As the number of degrees of freedom increases, the...Ch. 11 - The standard deviation of the chi-square...Ch. 11 - The mean and the median of the chi-square...Ch. 11 - A six-sided die is rolled 120 times. Fill in the...Ch. 11 - The marital status distribution of the U.S. male...Ch. 11 - Use the following information to answer the next...Ch. 11 - Use the following information to answer the next...Ch. 11 - The City of South Lake Tahoe, CA, has an Asian...Ch. 11 - Use the following information to answer the next...Ch. 11 - Use the following information to answer the next...Ch. 11 - In a goodness-of-fit test, the expected values are...Ch. 11 - In general, if the observed values and expected...Ch. 11 - Use a goodness-of-fit test to determine if high...Ch. 11 - The test to use to determine if a six-sided die is...Ch. 11 - In a goodness-of fit test, if the p-value is...Ch. 11 - A sample of 212 commercial businesses was surveyed...Ch. 11 - Table 11.42 contains information from a survey...Ch. 11 - A recent debate about where in the United States...Ch. 11 - Car manufacturers are interested in whether there...Ch. 11 - College students may be interested in whether or...Ch. 11 - Some travel agents claim that honeymoon hot spots...Ch. 11 - A manager of a sports club keeps information...Ch. 11 - A major food manufacturer is concerned that the...Ch. 11 - According to Dan Lenard, an independent insurance...Ch. 11 - Suppose that 600 thirty-year-olds were surveyed to...Ch. 11 - The number of degrees of freedom for a test of...Ch. 11 - The test for independence uses tables of observed...Ch. 11 - The test to use when determining if the college or...Ch. 11 - In a test of independence, the expected number is...Ch. 11 - An ice cream maker performs a nationwide survey...Ch. 11 - Table 11.52 provides a recent survey of the...Ch. 11 - A 2013 poll in California surveyed people about...Ch. 11 - A psychologist is interested in testing whether...Ch. 11 - Do men and women select different breakfasts? The...Ch. 11 - A fisherman is interested in whether the...Ch. 11 - In 2007, the United States had 1.5 million...Ch. 11 - When looking at energy consumption, we are often...Ch. 11 - The Insurance Institute for Highway Safety...Ch. 11 - Is there a difference between the distribution of...Ch. 11 - If df = 2, the chi-square distribution has a shape...Ch. 11 - Test of a Single Variance Use the following...Ch. 11 - Test of a Single Variance Use the following...Ch. 11 - Test of a Single Variance Use the following...Ch. 11 - Test of a Single Variance Use the following...Ch. 11 - Test of a Single Variance Use the following...Ch. 11 - Test of a Single Variance Use the following...Ch. 11 - Test of a Single Variance Use the following...Ch. 11 - Test of a Single Variance Use the following...Ch. 11 - Test of a Single Variance Use the following...Ch. 11 - Test of a Single Variance Use the following...Ch. 11 - Test of a Single Variance Use the following...Ch. 11 - Test of a Single Variance Use the following...Ch. 11 - A plant manager is concerned her equipment may...Ch. 11 - Consumers may be interested in whether the cost of...Ch. 11 - Isabella, an accomplished Bay to Breakers runner,...Ch. 11 - Airline companies are interested in the...Ch. 11 - The number of births per woman in China is 1.6...Ch. 11 - According to an avid aquarist, the average number...Ch. 11 - The manager of "Frenchies" is concerned that...Ch. 11 - You want to buy a specific computer. A sales...Ch. 11 - A company packages apples by weight. One of the...Ch. 11 - a. Explain why a goodness-of-fit test and a test...
Additional Math Textbook Solutions
Find more solutions based on key concepts
CHECK POINT 1 Find a counterexample to show that the statement The product of two two-digit numbers is a three-...
Thinking Mathematically (6th Edition)
Spring constant It took 1800 J of work to stretch a spring from its natural length of 2 m to a length of 5 m. F...
University Calculus: Early Transcendentals (4th Edition)
A child has 12 blocks, of which 6 are black, 4 are red, 1 is white, and 1 is blue. If the child puts the blocks...
A First Course in Probability (10th Edition)
TRY IT YOURSELF 1
Find the mean of the points scored by the 51 winning teams listed on page 39.
Elementary Statistics: Picturing the World (7th Edition)
Knowledge Booster


Learn more about
Need a deep-dive on the concept behind this application? Look no further. Learn more about this topic, statistics and related others by exploring similar questions and additional content below.Similar questions
- What would you say about a set of quantitative bivariate data whose linear correlation is -1? What would a scatter diagram of the data look like? (5 points)arrow_forwardBusiness discussarrow_forwardAnalyze the residuals of a linear regression model and select the best response. yes, the residual plot does not show a curve no, the residual plot shows a curve yes, the residual plot shows a curve no, the residual plot does not show a curve I answered, "No, the residual plot shows a curve." (and this was incorrect). I am not sure why I keep getting these wrong when the answer seems obvious. Please help me understand what the yes and no references in the answer.arrow_forward
- a. Find the value of A.b. Find pX(x) and py(y).c. Find pX|y(x|y) and py|X(y|x)d. Are x and y independent? Why or why not?arrow_forwardAnalyze the residuals of a linear regression model and select the best response.Criteria is simple evaluation of possible indications of an exponential model vs. linear model) no, the residual plot does not show a curve yes, the residual plot does not show a curve yes, the residual plot shows a curve no, the residual plot shows a curve I selected: yes, the residual plot shows a curve and it is INCORRECT. Can u help me understand why?arrow_forwardYou have been hired as an intern to run analyses on the data and report the results back to Sarah; the five questions that Sarah needs you to address are given below. please do it step by step on excel Does there appear to be a positive or negative relationship between price and screen size? Use a scatter plot to examine the relationship. Determine and interpret the correlation coefficient between the two variables. In your interpretation, discuss the direction of the relationship (positive, negative, or zero relationship). Also discuss the strength of the relationship. Estimate the relationship between screen size and price using a simple linear regression model and interpret the estimated coefficients. (In your interpretation, tell the dollar amount by which price will change for each unit of increase in screen size). Include the manufacturer dummy variable (Samsung=1, 0 otherwise) and estimate the relationship between screen size, price and manufacturer dummy as a multiple…arrow_forward
- Here is data with as the response variable. x y54.4 19.124.9 99.334.5 9.476.6 0.359.4 4.554.4 0.139.2 56.354 15.773.8 9-156.1 319.2Make a scatter plot of this data. Which point is an outlier? Enter as an ordered pair, e.g., (x,y). (x,y)= Find the regression equation for the data set without the outlier. Enter the equation of the form mx+b rounded to three decimal places. y_wo= Find the regression equation for the data set with the outlier. Enter the equation of the form mx+b rounded to three decimal places. y_w=arrow_forwardYou have been hired as an intern to run analyses on the data and report the results back to Sarah; the five questions that Sarah needs you to address are given below. please do it step by step Does there appear to be a positive or negative relationship between price and screen size? Use a scatter plot to examine the relationship. Determine and interpret the correlation coefficient between the two variables. In your interpretation, discuss the direction of the relationship (positive, negative, or zero relationship). Also discuss the strength of the relationship. Estimate the relationship between screen size and price using a simple linear regression model and interpret the estimated coefficients. (In your interpretation, tell the dollar amount by which price will change for each unit of increase in screen size). Include the manufacturer dummy variable (Samsung=1, 0 otherwise) and estimate the relationship between screen size, price and manufacturer dummy as a multiple linear…arrow_forwardExercises: Find all the whole number solutions of the congruence equation. 1. 3x 8 mod 11 2. 2x+3= 8 mod 12 3. 3x+12= 7 mod 10 4. 4x+6= 5 mod 8 5. 5x+3= 8 mod 12arrow_forward
- Scenario Sales of products by color follow a peculiar, but predictable, pattern that determines how many units will sell in any given year. This pattern is shown below Product Color 1995 1996 1997 Red 28 42 21 1998 23 1999 29 2000 2001 2002 Unit Sales 2003 2004 15 8 4 2 1 2005 2006 discontinued Green 26 39 20 22 28 14 7 4 2 White 43 65 33 36 45 23 12 Brown 58 87 44 48 60 Yellow 37 56 28 31 Black 28 42 21 Orange 19 29 Purple Total 28 42 21 49 68 78 95 123 176 181 164 127 24 179 Questions A) Which color will sell the most units in 2007? B) Which color will sell the most units combined in the 2007 to 2009 period? Please show all your analysis, leave formulas in cells, and specify any assumptions you make.arrow_forwardOne hundred students were surveyed about their preference between dogs and cats. The following two-way table displays data for the sample of students who responded to the survey. Preference Male Female TOTAL Prefers dogs \[36\] \[20\] \[56\] Prefers cats \[10\] \[26\] \[36\] No preference \[2\] \[6\] \[8\] TOTAL \[48\] \[52\] \[100\] problem 1 Find the probability that a randomly selected student prefers dogs.Enter your answer as a fraction or decimal. \[P\left(\text{prefers dogs}\right)=\] Incorrect Check Hide explanation Preference Male Female TOTAL Prefers dogs \[\blueD{36}\] \[\blueD{20}\] \[\blueE{56}\] Prefers cats \[10\] \[26\] \[36\] No preference \[2\] \[6\] \[8\] TOTAL \[48\] \[52\] \[100\] There were \[\blueE{56}\] students in the sample who preferred dogs out of \[100\] total students.arrow_forwardBusiness discussarrow_forward
arrow_back_ios
SEE MORE QUESTIONS
arrow_forward_ios
Recommended textbooks for you
 Algebra & Trigonometry with Analytic GeometryAlgebraISBN:9781133382119Author:SwokowskiPublisher:Cengage
 Big Ideas Math A Bridge To Success Algebra 1: Stu...AlgebraISBN:9781680331141Author:HOUGHTON MIFFLIN HARCOURTPublisher:Houghton Mifflin Harcourt
 Glencoe Algebra 1, Student Edition, 9780079039897...AlgebraISBN:9780079039897Author:CarterPublisher:McGraw Hill
 Algebra: Structure And Method, Book 1AlgebraISBN:9780395977224Author:Richard G. Brown, Mary P. Dolciani, Robert H. Sorgenfrey, William L. ColePublisher:McDougal Littell
 College Algebra (MindTap Course List)AlgebraISBN:9781305652231Author:R. David Gustafson, Jeff HughesPublisher:Cengage Learning
 Holt Mcdougal Larson Pre-algebra: Student Edition...AlgebraISBN:9780547587776Author:HOLT MCDOUGALPublisher:HOLT MCDOUGAL
Algebra & Trigonometry with Analytic Geometry
Algebra
ISBN:9781133382119
Author:Swokowski
Publisher:Cengage
Big Ideas Math A Bridge To Success Algebra 1: Stu...
Algebra
ISBN:9781680331141
Author:HOUGHTON MIFFLIN HARCOURT
Publisher:Houghton Mifflin Harcourt
Glencoe Algebra 1, Student Edition, 9780079039897...
Algebra
ISBN:9780079039897
Author:Carter
Publisher:McGraw Hill
Algebra: Structure And Method, Book 1
Algebra
ISBN:9780395977224
Author:Richard G. Brown, Mary P. Dolciani, Robert H. Sorgenfrey, William L. Cole
Publisher:McDougal Littell
College Algebra (MindTap Course List)
Algebra
ISBN:9781305652231
Author:R. David Gustafson, Jeff Hughes
Publisher:Cengage Learning
Holt Mcdougal Larson Pre-algebra: Student Edition...
Algebra
ISBN:9780547587776
Author:HOLT MCDOUGAL
Publisher:HOLT MCDOUGAL
Statistics 4.1 Point Estimators; Author: Dr. Jack L. Jackson II;https://www.youtube.com/watch?v=2MrI0J8XCEE;License: Standard YouTube License, CC-BY
Statistics 101: Point Estimators; Author: Brandon Foltz;https://www.youtube.com/watch?v=4v41z3HwLaM;License: Standard YouTube License, CC-BY
Central limit theorem; Author: 365 Data Science;https://www.youtube.com/watch?v=b5xQmk9veZ4;License: Standard YouTube License, CC-BY
Point Estimate Definition & Example; Author: Prof. Essa;https://www.youtube.com/watch?v=OTVwtvQmSn0;License: Standard Youtube License
Point Estimation; Author: Vamsidhar Ambatipudi;https://www.youtube.com/watch?v=flqhlM2bZWc;License: Standard Youtube License