
MYLAB ELEMENTARY STATISTICS
13th Edition
ISBN: 9781323789667
Author: Triola
Publisher: PEARSON C
expand_more
expand_more
format_list_bulleted
Videos
Textbook Question
Chapter 11, Problem 5CRE
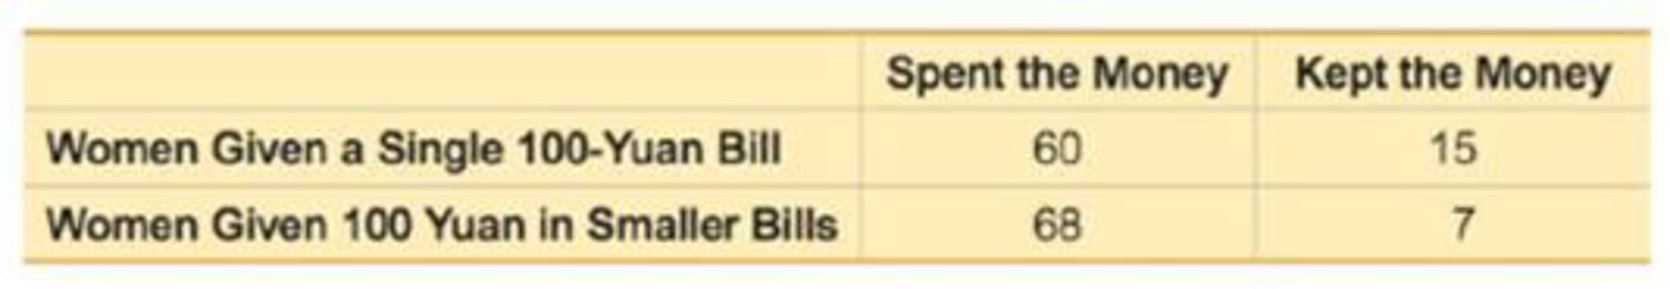
One Big Bill or Many Smaller Bills In a study of the “denomination effect,” 150 women in China were given either a single 100 yuan bill or a total of 100 yuan in smaller bills. The value of 100 yuan is about $15. The women were given the choice of spending the money on specific items or keeping the money. The results are summarized in the table below (based on “The Denomination Effect,” by Priya Raghubir and Joydeep Srivastava, Journal of Consumer Research, Vol. 36). Use a 0.05 significance level to test the claim that the form of the 100 yuan is independent of whether the money was spent. What does the result suggest about a denomination effect?
Expert Solution & Answer

Trending nowThis is a popular solution!

Students have asked these similar questions
Question 3
3200 students were asked about the importance of study groups in successfully completing their
courses. They were asked to provide their current majors as well as their opinion. The results are given
below:
Major
Opinion Psychology Sociology Economics Statistics Accounting Total
Agree
144
183
201
271
251
1050
Disagree
230
233
254
227
218
1162
Impartial
201
181
196
234
176
988
Total
575
597
651
732
645
3200
a. State both the null and alternative hypotheses.
b. Provide the decision rule for making this decision. Use an alpha level of 5%.
c. Show all of the work necessary to calculate the appropriate statistic. |
d. What conclusion are you allowed to draw?
c. Would your conclusion change at the 10% level of significance?
f. Confirm test results in part (c) using JASP. Note: All JASP input files and output
tables should be provided
Question 1
A tech company has acknowledged the importance of having records of all meetings conducted.
The meetings are very fast paced and requires equipment that is able to capture the information in
the shortest possible time. There are two options, using a typewriter or a word processor. Fifteen
administrative assistants are selected and the amount of typing time in hours was recorded. The
results are given below:
1
2
3
4
5
6
7
8
9
10
11 12 13
14
15
typewriter
8.0 6.5
5.0 6.7
7.8
8.5
7.2
5.7
9.2
5.7 6.5
word processor 7.2 5.7
8.3
7.5
9.2
7.2
6.5
7.0
6.9
34
7.0 6.9
8.8
6.7
8.8 9.4 8.6 5.5 7.2
8.4
a. Test the hypothesis that the mean typing time in hours for typewriters is less than 7.0.
Use the 1% level of significance.
b. Construct a 90% confidence interval for the difference in mean typing time in hours,
where a difference is equal to the typing time in hours of word processors minus typing
time in hours of typewriter.
c. Using the 5% significance level, determine whether there is…
Illustrate 2/7×4/5 using a rectangular region. Explain your work. 
Chapter 11 Solutions
MYLAB ELEMENTARY STATISTICS
Ch. 11.1 - Cybersecurity The table below lists leading digits...Ch. 11.1 - 2. Cybersecurity When using the data from Exercise...Ch. 11.1 - Cybersecurity The accompanying Statdisk results...Ch. 11.1 - Cybersecurity What do the results from the...Ch. 11.1 - In Exercises 520, conduct the hypothesis test and...Ch. 11.1 - In Exercises 520, conduct the hypothesis test and...Ch. 11.1 - In Exercises 520, conduct the hypothesis test and...Ch. 11.1 - In Exercises 520, conduct the hypothesis test and...Ch. 11.1 - In Exercises 520, conduct the hypothesis test and...Ch. 11.1 - In Exercises 520, conduct the hypothesis test and...
Ch. 11.1 - In Exercises 520, conduct the hypothesis test and...Ch. 11.1 - In Exercises 520, conduct the hypothesis test and...Ch. 11.1 - In Exercises 520, conduct the hypothesis test and...Ch. 11.1 - In Exercises 520, conduct the hypothesis test and...Ch. 11.1 - In Exercises 520, conduct the hypothesis test and...Ch. 11.1 - In Exercises 520, conduct the hypothesis test and...Ch. 11.1 - In Exercises 520, conduct the hypothesis test and...Ch. 11.1 - In Exercises 520, conduct the hypothesis test and...Ch. 11.1 - In Exercises 520, conduct the hypothesis test and...Ch. 11.1 - In Exercises 520, conduct the hypothesis test and...Ch. 11.1 - Ben fords Law. According to Benfords law, a...Ch. 11.1 - Ben fords Law. According to Benfords law, a...Ch. 11.1 - Ben fords Law. According to Benfords law, a...Ch. 11.1 - Ben fords Law. According to Benfords law, a...Ch. 11.1 - Assumed mid-point x=fxn=39825180=221.25...Ch. 11.2 - Handedness and Cell Phone Use The accompanying...Ch. 11.2 - Ear Preference for Cell Phone Use 2. Hypotheses...Ch. 11.2 - Hypothesis Test The accompanying TI-83/84 Plus...Ch. 11.2 - Right-Tailed, Left-Tailed, Two-Tailed Is the...Ch. 11.2 - Prob. 5BSCCh. 11.2 - In Exercises 5-18, test the given claim. 6. Splint...Ch. 11.2 - In Exercises 5-18, test the given claim. 7....Ch. 11.2 - Prob. 8BSCCh. 11.2 - In Exercises 5-18, test the given claim. 9. Four...Ch. 11.2 - In Exercises 5-18, test the given claim. 10....Ch. 11.2 - In Exercises 5-18, test the given claim. 11....Ch. 11.2 - In Exercises 5-18, test the given claim. 12. Nurse...Ch. 11.2 - Soccer Strategy In soccer, serious fouls in the...Ch. 11.2 - In Exercises 5-18, lest the given claim. 14. Is...Ch. 11.2 - In Exercises 518, test the given claim. 15....Ch. 11.2 - In Exercises 5-18, test the given claim. 16....Ch. 11.2 - Prob. 17BSCCh. 11.2 - In Exercises 5-18, test the given claim. 18....Ch. 11.2 - In Exercises 5-18, lest the given claim. 19. Car...Ch. 11.2 - Is the Home Field Advantage Independent of the...Ch. 11.2 - Equivalent Tests A X2 test involving a 2 2 table...Ch. 11.2 - Using Yatess Correction for Continuity The...Ch. 11 - Exercises 1-5 refer to the sample data in the...Ch. 11 - Exercises 15 refer to the sample data in the...Ch. 11 - Exercises 15 refer to the sample data in the...Ch. 11 - Prob. 4CQQCh. 11 - Exercises 15 refer to the sample data in the...Ch. 11 - Questions 610 refer to the sample data in the...Ch. 11 - Questions 610 refer to the sample data in the...Ch. 11 - Questions 6-10 refer to the sample data in the...Ch. 11 - Find the number of degrees of freedom.Ch. 11 - Questions 6-10 refer to the sample data in the...Ch. 11 - Motor Vehicle Fatalities The table below lists...Ch. 11 - Tooth Fillings The table below shows results from...Ch. 11 - American Idol Contestants on the TV show American...Ch. 11 - Clinical Trial of Lipitor Lipitor is the trade...Ch. 11 - Weather-Related Deaths For a recent year, the...Ch. 11 - Weather-Related Deaths Review Exercise 5 involved...Ch. 11 - Chocolate and Happiness In a survey sponsored by...Ch. 11 - Chocolate and Happiness Use the results from part...Ch. 11 - Chocolate and Happiness Use the results from part...Ch. 11 - One Big Bill or Many Smaller Bills In a study of...Ch. 11 - 6. Probability Refer to the results from the 150...Ch. 11 - Car Repair Costs Listed below are repair costs (in...Ch. 11 - Forward Grip Reach and Ergonomics When designing...Ch. 11 - Use Statdisk, Minitab, Excel, StatCrunch, a...Ch. 11 - FROM DATA TO DECISION Critical Thinking: Was...
Knowledge Booster


Learn more about
Need a deep-dive on the concept behind this application? Look no further. Learn more about this topic, statistics and related others by exploring similar questions and additional content below.Similar questions
- Write three other different proportions equivalent to the following using the same values as in the given proportion 3 foot over 1 yard equals X feet over 5 yardsarrow_forward2. An experiment is set up to test the effectiveness of a new drug for balancing people's mood. The table below contains the results of the patients before and after taking the drug. The possible scores are the integers from 0 to 10, where 0 indicates a depressed mood and 10 indicates and elated mood. Patient Before After 1 4 4 2 3 3 3 6 4 4 1 2 5 6 5 6 1 3 7 4 7 8 6 9 1 4 10 5 4 Assuming the differences of the observations to be symmetric, but not normally distributed, investigate the effectiveness of the drug at the 5% significance level. [4 Marks]arrow_forward3. (i) Consider the following R code: wilcox.test(UK Supermarkets $Salary ~ UKSupermarkets $Supermarket) (a) Which test is being used in this code? (b) What is the name of the dataset under consideration? How would be adapt this code if we had ties? What other command can be used which deals with ties? (ii) Consider the following R code: install packages("nortest") library(nortest) lillie.test (Differences) (a) Assuming the appropriate dataset has been imported and attached, what is wrong with this code? (b) If this code were to be corrected, what would be determined by run- ning it? [3 Marks]arrow_forward
- 1. (i) Explain the difference in application between the Mann-Whitney U test and the Wilcoxon Signed-Rank test, i.e. in which scenarios would each test be used? (ii) What is the main procedure underlying these nonparametric tests? [3 Marks]arrow_forwardYou may need to use the appropriate appendix table or technology to answer this question. You are given the following information obtained from a random sample of 4 observations. 24 48 31 57 You want to determine whether or not the mean of the population from which this sample was taken is significantly different from 49. (Assume the population is normally distributed.) (a) State the null and the alternative hypotheses. (Enter != for ≠ as needed.) H0: Ha: (b) Determine the test statistic. (Round your answer to three decimal places.) (c) Determine the p-value, and at the 5% level of significance, test to determine whether or not the mean of the population is significantly different from 49. Find the p-value. (Round your answer to four decimal places.) p-value = State your conclusion. Reject H0. There is insufficient evidence to conclude that the mean of the population is different from 49.Do not reject H0. There is sufficient evidence to conclude that the…arrow_forward65% of all violent felons in the prison system are repeat offenders. If 43 violent felons are randomly selected, find the probability that a. Exactly 28 of them are repeat offenders. b. At most 28 of them are repeat offenders. c. At least 28 of them are repeat offenders. d. Between 22 and 26 (including 22 and 26) of them are repeat offenders.arrow_forward
- 08:34 ◄ Classroom 07:59 Probs. 5-32/33 D ا. 89 5-34. Determine the horizontal and vertical components of reaction at the pin A and the normal force at the smooth peg B on the member. A 0,4 m 0.4 m Prob. 5-34 F=600 N fr th ar 0. 163586 5-37. The wooden plank resting between the buildings deflects slightly when it supports the 50-kg boy. This deflection causes a triangular distribution of load at its ends. having maximum intensities of w, and wg. Determine w and wg. each measured in N/m. when the boy is standing 3 m from one end as shown. Neglect the mass of the plank. 0.45 m 3 marrow_forwardExamine the Variables: Carefully review and note the names of all variables in the dataset. Examples of these variables include: Mileage (mpg) Number of Cylinders (cyl) Displacement (disp) Horsepower (hp) Research: Google to understand these variables. Statistical Analysis: Select mpg variable, and perform the following statistical tests. Once you are done with these tests using mpg variable, repeat the same with hp Mean Median First Quartile (Q1) Second Quartile (Q2) Third Quartile (Q3) Fourth Quartile (Q4) 10th Percentile 70th Percentile Skewness Kurtosis Document Your Results: In RStudio: Before running each statistical test, provide a heading in the format shown at the bottom. “# Mean of mileage – Your name’s command” In Microsoft Word: Once you've completed all tests, take a screenshot of your results in RStudio and paste it into a Microsoft Word document. Make sure that snapshots are very clear. You will need multiple snapshots. Also transfer these results to the…arrow_forwardExamine the Variables: Carefully review and note the names of all variables in the dataset. Examples of these variables include: Mileage (mpg) Number of Cylinders (cyl) Displacement (disp) Horsepower (hp) Research: Google to understand these variables. Statistical Analysis: Select mpg variable, and perform the following statistical tests. Once you are done with these tests using mpg variable, repeat the same with hp Mean Median First Quartile (Q1) Second Quartile (Q2) Third Quartile (Q3) Fourth Quartile (Q4) 10th Percentile 70th Percentile Skewness Kurtosis Document Your Results: In RStudio: Before running each statistical test, provide a heading in the format shown at the bottom. “# Mean of mileage – Your name’s command” In Microsoft Word: Once you've completed all tests, take a screenshot of your results in RStudio and paste it into a Microsoft Word document. Make sure that snapshots are very clear. You will need multiple snapshots. Also transfer these results to the…arrow_forward
- Examine the Variables: Carefully review and note the names of all variables in the dataset. Examples of these variables include: Mileage (mpg) Number of Cylinders (cyl) Displacement (disp) Horsepower (hp) Research: Google to understand these variables. Statistical Analysis: Select mpg variable, and perform the following statistical tests. Once you are done with these tests using mpg variable, repeat the same with hp Mean Median First Quartile (Q1) Second Quartile (Q2) Third Quartile (Q3) Fourth Quartile (Q4) 10th Percentile 70th Percentile Skewness Kurtosis Document Your Results: In RStudio: Before running each statistical test, provide a heading in the format shown at the bottom. “# Mean of mileage – Your name’s command” In Microsoft Word: Once you've completed all tests, take a screenshot of your results in RStudio and paste it into a Microsoft Word document. Make sure that snapshots are very clear. You will need multiple snapshots. Also transfer these results to the…arrow_forward2 (VaR and ES) Suppose X1 are independent. Prove that ~ Unif[-0.5, 0.5] and X2 VaRa (X1X2) < VaRa(X1) + VaRa (X2). ~ Unif[-0.5, 0.5]arrow_forward8 (Correlation and Diversification) Assume we have two stocks, A and B, show that a particular combination of the two stocks produce a risk-free portfolio when the correlation between the return of A and B is -1.arrow_forward
arrow_back_ios
SEE MORE QUESTIONS
arrow_forward_ios
Recommended textbooks for you
 Big Ideas Math A Bridge To Success Algebra 1: Stu...AlgebraISBN:9781680331141Author:HOUGHTON MIFFLIN HARCOURTPublisher:Houghton Mifflin Harcourt
 Holt Mcdougal Larson Pre-algebra: Student Edition...AlgebraISBN:9780547587776Author:HOLT MCDOUGALPublisher:HOLT MCDOUGAL
 Glencoe Algebra 1, Student Edition, 9780079039897...AlgebraISBN:9780079039897Author:CarterPublisher:McGraw Hill
 Algebra & Trigonometry with Analytic GeometryAlgebraISBN:9781133382119Author:SwokowskiPublisher:Cengage
Big Ideas Math A Bridge To Success Algebra 1: Stu...
Algebra
ISBN:9781680331141
Author:HOUGHTON MIFFLIN HARCOURT
Publisher:Houghton Mifflin Harcourt
Holt Mcdougal Larson Pre-algebra: Student Edition...
Algebra
ISBN:9780547587776
Author:HOLT MCDOUGAL
Publisher:HOLT MCDOUGAL
Glencoe Algebra 1, Student Edition, 9780079039897...
Algebra
ISBN:9780079039897
Author:Carter
Publisher:McGraw Hill
Algebra & Trigonometry with Analytic Geometry
Algebra
ISBN:9781133382119
Author:Swokowski
Publisher:Cengage
Hypothesis Testing using Confidence Interval Approach; Author: BUM2413 Applied Statistics UMP;https://www.youtube.com/watch?v=Hq1l3e9pLyY;License: Standard YouTube License, CC-BY
Hypothesis Testing - Difference of Two Means - Student's -Distribution & Normal Distribution; Author: The Organic Chemistry Tutor;https://www.youtube.com/watch?v=UcZwyzwWU7o;License: Standard Youtube License