
Concept explainers
Videos
Application Exercises
The graphs show the percentage of high school seniors who had ever used alcohol or marijuana.
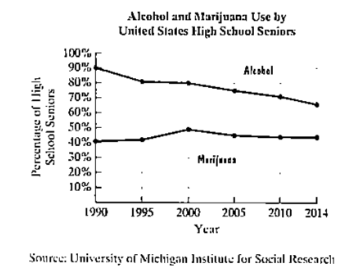
The data can be described by the following mathematical models:

Use this information to solve Exercises 55–56.
a. Use the appropriate line graph to estimate the percentage of seniors who used alcohol in 2014.
b. Use the appropriate formula to determine the percentage of seniors who used alcohol in 2014. How does this compare with your estimate in part (a)?
c. Use the appropriate line graph to estimate the percentage of seniors who used marijuana in 2014.
d. Use the appropriate formula to determine the percentage of seniors who used marijuana in 2014. How does this compare with your estimate in part (c)?
e. For the period from 1990 through 2014, in which year was alcohol use by seniors at a maximum? What percentage of seniors used alcohol in that year.
Want to see the full answer?
Check out a sample textbook solution
Chapter 1 Solutions
MyLab Math with Pearson eText -- Standalone Access Card -- for College Algebra (7th Edition)(Outer package may vary)


- 20 2. Let A = = [ -2 0 1 3 ] and B = 2 3 -1 2 For each of the following, calculate the product or indicate why it is undefined: (a) AB (b) BAarrow_forwardAnswer the number questions with the following answers +/- 2 sqrt(2) +/- i sqrt(6) (-3 +/-3 i sqrt(3))/4 +/-1 +/- sqrt(6) +/- 2/3 sqrt(3) 4 -3 +/- 3 i sqrt(3)arrow_forward1 Matching 10 points Factor and Solve 1)x3-216 0, x = {6,[B]} 2) 16x3 = 54 x-[3/2,[D]] 3)x4x2-42 0 x= [ +/-isqrt(7), [F] } 4)x+3-13-9x x=[+/-1.[H]] 5)x38x2+16x=0, x = {0,[K}} 6) 2x6-10x-48x2-0 x-[0, [M], +/-isqrt(3)) 7) 3x+2x²-8 x = {+/-i sqrt(2), {Q}} 8) 5x³-3x²+32x=2x+18 x = {3/5, [S]} [B] [D] [F] [H] [K] [M] [Q] +/-2 sqrt(2) +/- i sqrt(6) (-3+/-3 i sqrt(3))/4 +/- 1 +/-sqrt(6) +/- 2/3 sqrt(3) 4 -3 +/- 3 i sqrt(3) [S]arrow_forward
- The only problems I need help with ae the last 8 ones, Thanksarrow_forwardGraph without using the calculator y-1 = | x+4 |arrow_forward9:43 AS く Akbar © Printed in the United States 15) Scale: 1 cmal unit on both axes .ill 64% The graph above shows a straight line QT intersecting the y-axis at T. i State the co-ordinates of T. ii Calculate the gradient of QT 16) iii Determine the equation of QT. A (-1, 9) ||| i L Г (5 marks)arrow_forward
 Trigonometry (MindTap Course List)TrigonometryISBN:9781337278461Author:Ron LarsonPublisher:Cengage Learning
 Glencoe Algebra 1, Student Edition, 9780079039897...AlgebraISBN:9780079039897Author:CarterPublisher:McGraw Hill