
Concept explainers
Videos
Hours of Television by Age Group The StatCrunch output shows the ANOVA results for testing whether there is an association between the number of hours of TV watched per week and age group: 50 and over (AdultTV), college students (TeenTV), and grade school students (ChildTV).
a. Test the hypothesis that people in different age groups spend different amounts of time, on average, watching television. Use a significance level of 0.05. Assume that the conditions for ANOVA are met.
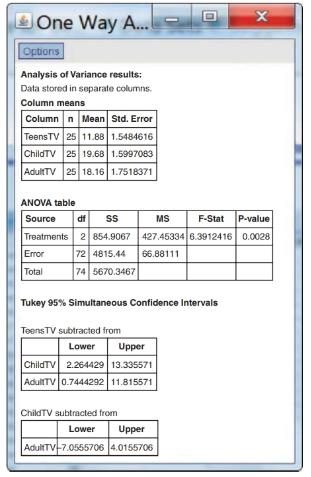
b. Using the output provided, determine which sample means are significantly different from each other. Report all the given confidence intervals for the difference between means, and tell what they show. Then arrange the groups with lowest
Want to see the full answer?
Check out a sample textbook solution
Chapter 11 Solutions
Pearson eText Introductory Statistics: Exploring the World Through Data -- Instant Access (Pearson+)
Additional Math Textbook Solutions
Math in Our World
Elementary Statistics: Picturing the World (7th Edition)
APPLIED STAT.IN BUS.+ECONOMICS
Elementary Statistics ( 3rd International Edition ) Isbn:9781260092561
Elementary and Intermediate Algebra: Concepts and Applications (7th Edition)
Beginning and Intermediate Algebra


- A company found that the daily sales revenue of its flagship product follows a normal distribution with a mean of $4500 and a standard deviation of $450. The company defines a "high-sales day" that is, any day with sales exceeding $4800. please provide a step by step on how to get the answers in excel Q: What percentage of days can the company expect to have "high-sales days" or sales greater than $4800? Q: What is the sales revenue threshold for the bottom 10% of days? (please note that 10% refers to the probability/area under bell curve towards the lower tail of bell curve) Provide answers in the yellow cellsarrow_forwardFind the critical value for a left-tailed test using the F distribution with a 0.025, degrees of freedom in the numerator=12, and degrees of freedom in the denominator = 50. A portion of the table of critical values of the F-distribution is provided. Click the icon to view the partial table of critical values of the F-distribution. What is the critical value? (Round to two decimal places as needed.)arrow_forwardA retail store manager claims that the average daily sales of the store are $1,500. You aim to test whether the actual average daily sales differ significantly from this claimed value. You can provide your answer by inserting a text box and the answer must include: Null hypothesis, Alternative hypothesis, Show answer (output table/summary table), and Conclusion based on the P value. Showing the calculation is a must. If calculation is missing,so please provide a step by step on the answers Numerical answers in the yellow cellsarrow_forward
 Glencoe Algebra 1, Student Edition, 9780079039897...AlgebraISBN:9780079039897Author:CarterPublisher:McGraw Hill
 College Algebra (MindTap Course List)AlgebraISBN:9781305652231Author:R. David Gustafson, Jeff HughesPublisher:Cengage Learning
 Big Ideas Math A Bridge To Success Algebra 1: Stu...AlgebraISBN:9781680331141Author:HOUGHTON MIFFLIN HARCOURTPublisher:Houghton Mifflin Harcourt
 Holt Mcdougal Larson Pre-algebra: Student Edition...AlgebraISBN:9780547587776Author:HOLT MCDOUGALPublisher:HOLT MCDOUGAL