Videos
The results of a study on the effectiveness of line drying on the smoothness of fabric were summarized in the article “Line-Dried vs. Machine-Dried Fabrics: Comparison of Appearance, Hand, and Consumer Acceptance” (Home Econ. Research J., 1984: 27–35). Smoothness scores were given for nine different types of fabric and five different drying methods: (1) machine dry, (2) line dry, (3) line dry followed by 15-min tumble, (4) line dry with softener, and (5) line dry with air movement. Regarding the different types of fabric as blocks, construct an ANOVA table. Using a .05 significance level, test to see whether there is a difference in the true
| Drying Method | ||||||
| Fabric | 1 | 2 | 3 | 4 | 5 | |
| Crepe | 3.3 | 2.5 | 2.8 | 2.5 | 1.9 | |
| Double knit | 3.6 | 2.0 | 3.6 | 2.4 | 2.3 | |
| Twill | 4.2 | 3.4 | 3.8 | 3.1 | 3.1 | |
| Twill mix | 3.4 | 2.4 | 2.9 | 1.6 | 1.7 | |
| Terry | 3.8 | 1.3 | 2.8 | 2.0 | 1.6 | |
| Broadcloth | 2.2 | 1.5 | 2.7 | 1.5 | 1.9 | |
| Sheeting | 3.5 | 2.1 | 2.8 | 2.1 | 2.2 | |
| Corduroy | 3.6 | 1.3 | 2.8 | 1.7 | 1.8 | |
| Denim | 2.6 | 1.4 | 2.4 | 1.3 | 1.6 | |
Test the hypothesis to see whether there is any significant difference in the mean smoothness score due to the drying methods at 5% level of significance.
Answer to Problem 50SE
There is sufficient of evidence to conclude that there is significant difference in the mean smoothness score due to the drying methods at 5% level of significance.
Explanation of Solution
The data shows the mean smoothness of the fabric for five levels of drying methods with nine different types of fabrics..
Calculation:
There is no significant difference in the mean smoothness with respect to the five levels of drying methods.
There is difference in the mean smoothness with respect to the five levels of drying methods.
Software procedure:
Step by step procedure to find the test statistic using Minitab is given below:
- Click on Stat>ANOVA>Two-Way Analysis of Variance.
- Under Response, enter the column of mean smoothness.
- Under Row factor, enter the column of drying method.
- Under column factor, enter the column of fabric.
- Click OK.
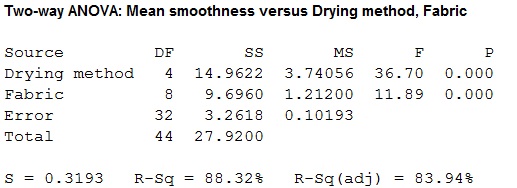
Output obtained from MINITAB is given below:
Conclusion:
For drying methods:
The P-value for the drying methods is 0.000 and the level of significance is 0.05.
Here, the P-value is lesser than the level of significance.
That is,
Thus, the null hypothesis is rejected
Hence, there is sufficient evidence to conclude that there is an effect of drying methods on the mean smoothness of the fabric at 5% level of significance.
Want to see more full solutions like this?
Chapter 11 Solutions
Bundle: Probability and Statistics for Engineering and the Sciences, Loose-leaf Version, 9th + WebAssign Printed Access Card for Devore's Probability ... and the Sciences, 9th Edition, Single-Term


- F Make a box plot from the five-number summary: 100, 105, 120, 135, 140. harrow_forward14 Is the standard deviation affected by skewed data? If so, how? foldarrow_forwardFrequency 15 Suppose that your friend believes his gambling partner plays with a loaded die (not fair). He shows you a graph of the outcomes of the games played with this die (see the following figure). Based on this graph, do you agree with this person? Why or why not? 65 Single Die Outcomes: Graph 1 60 55 50 45 40 1 2 3 4 Outcome 55 6arrow_forward
- lie y H 16 The first month's telephone bills for new customers of a certain phone company are shown in the following figure. The histogram showing the bills is misleading, however. Explain why, and suggest a solution. Frequency 140 120 100 80 60 40 20 0 0 20 40 60 80 Telephone Bill ($) 100 120arrow_forward25 ptical rule applies because t Does the empirical rule apply to the data set shown in the following figure? Explain. 2 6 5 Frequency 3 сл 2 1 0 2 4 6 8 00arrow_forward24 Line graphs typically connect the dots that represent the data values over time. If the time increments between the dots are large, explain why the line graph can be somewhat misleading.arrow_forward
- 17 Make a box plot from the five-number summary: 3, 4, 7, 16, 17. 992) waarrow_forward12 10 - 8 6 4 29 0 Interpret the shape, center and spread of the following box plot. brill smo slob.nl bagharrow_forwardSuppose that a driver's test has a mean score of 7 (out of 10 points) and standard deviation 0.5. a. Explain why you can reasonably assume that the data set of the test scores is mound-shaped. b. For the drivers taking this particular test, where should 68 percent of them score? c. Where should 95 percent of them score? d. Where should 99.7 percent of them score? Sarrow_forward
- 13 Can the mean of a data set be higher than most of the values in the set? If so, how? Can the median of a set be higher than most of the values? If so, how? srit to estaarrow_forwardA random variable X takes values 0 and 1 with probabilities q and p, respectively, with q+p=1. find the moment generating function of X and show that all the moments about the origin equal p. (Note- Please include as much detailed solution/steps in the solution to understand, Thank you!)arrow_forward1 (Expected Shortfall) Suppose the price of an asset Pt follows a normal random walk, i.e., Pt = Po+r₁ + ... + rt with r₁, r2,... being IID N(μ, o²). Po+r1+. ⚫ Suppose the VaR of rt is VaRq(rt) at level q, find the VaR of the price in T days, i.e., VaRq(Pt – Pt–T). - • If ESq(rt) = A, find ES₁(Pt – Pt–T).arrow_forward
 Big Ideas Math A Bridge To Success Algebra 1: Stu...AlgebraISBN:9781680331141Author:HOUGHTON MIFFLIN HARCOURTPublisher:Houghton Mifflin Harcourt
 Glencoe Algebra 1, Student Edition, 9780079039897...AlgebraISBN:9780079039897Author:CarterPublisher:McGraw Hill