Statistical Techniques in Business and Economics
18th Edition
ISBN: 9781260788785
Author: Lind, Douglas
Publisher: MCGRAW-HILL HIGHER EDUCATION
expand_more
expand_more
format_list_bulleted
Videos
Textbook Question
Chapter 11, Problem 3SR
It is often useful for companies to know who their customers are and how they became customers. A credit card company is interested in whether the owner of the card applied for the card on his or her own or was contacted by a telemarketer. The company obtained the following sample information regarding end-of-the-month balances for the two groups.
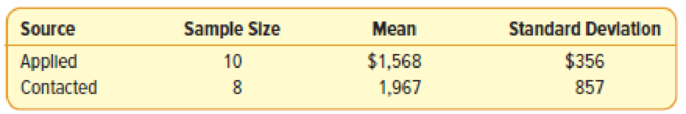
Is it reasonable to conclude the
- (a) State the null hypothesis and the alternate hypothesis.
- (b) How many degrees of freedom are there?
- (c) What is the decision rule?
- (d) What is the value of the test statistic?
- (e) What is your decision regarding the null hypothesis?
- (f) Interpret the result.
Expert Solution & Answer
Want to see the full answer?
Check out a sample textbook solution
Students have asked these similar questions
Please provide the solution for the attached image in detailed.
20 km, because
GISS
Worksheet 10
Jesse runs a small business selling and delivering mealie meal to the spaza shops.
He charges a fixed rate of R80, 00 for delivery and then R15, 50 for each packet of
mealle meal he delivers. The table below helps him to calculate what to charge
his customers.
10
20
30
40
50
Packets of mealie
meal (m)
Total costs in Rands
80
235
390
545
700
855
(c)
10.1.
Define the following terms:
10.1.1. Independent Variables
10.1.2. Dependent Variables
10.2.
10.3.
10.4.
10.5.
Determine the independent and dependent variables.
Are the variables in this scenario discrete or continuous values? Explain
What shape do you expect the graph to be? Why?
Draw a graph on the graph provided to represent the information in the
table above.
TOTAL COST OF PACKETS OF MEALIE MEAL
900
800
700
600
COST (R)
500
400
300
200
100
0
10
20
30
40
60
NUMBER OF PACKETS OF MEALIE MEAL
Let X be a random variable with support SX = {−3, 0.5, 3, −2.5, 3.5}. Part ofits probability mass function (PMF) is given bypX(−3) = 0.15, pX(−2.5) = 0.3, pX(3) = 0.2, pX(3.5) = 0.15.(a) Find pX(0.5).(b) Find the cumulative distribution function (CDF), FX(x), of X.1(c) Sketch the graph of FX(x).
Chapter 11 Solutions
Statistical Techniques in Business and Economics
Ch. 11 - Tom Sevits is the owner of the Appliance Patch....Ch. 11 - Prob. 1ECh. 11 - Prob. 2ECh. 11 - Prob. 3ECh. 11 - As part of a study of corporate employees, the...Ch. 11 - Prob. 5ECh. 11 - Mary Jo Fitzpatrick is the vice president for...Ch. 11 - Prob. 2SRCh. 11 - Prob. 7ECh. 11 - For Exercises 7 and 8: (a) state the decision...
Ch. 11 - Prob. 9ECh. 11 - A recent study compared the time spent together by...Ch. 11 - Ms. Lisa Monnin is the budget director for Nexus...Ch. 11 - The Tampa Bay (Florida) Area Chamber of Commerce...Ch. 11 - It is often useful for companies to know who their...Ch. 11 - For exercises 13 and 14, assume the sample...Ch. 11 - Prob. 14ECh. 11 - Prob. 15ECh. 11 - Suppose you are an expert on the fashion industry...Ch. 11 - Prob. 4SRCh. 11 - Prob. 17ECh. 11 - The null and alternate hypotheses are: H0:d=a0...Ch. 11 - Prob. 19ECh. 11 - Prob. 20ECh. 11 - A recent study focused on the number of times men...Ch. 11 - Clark Heter is an industrial engineer at Lyons...Ch. 11 - Prob. 23CECh. 11 - Prob. 24CECh. 11 - Prob. 25CECh. 11 - Prob. 26CECh. 11 - Prob. 27CECh. 11 - Prob. 28CECh. 11 - Prob. 29CECh. 11 - Prob. 30CECh. 11 - Prob. 31CECh. 11 - Prob. 32CECh. 11 - Prob. 33CECh. 11 - Prob. 34CECh. 11 - Prob. 35CECh. 11 - Prob. 36CECh. 11 - Prob. 37CECh. 11 - Prob. 38CECh. 11 - Prob. 39CECh. 11 - Prob. 40CECh. 11 - Prob. 41CECh. 11 - Prob. 42CECh. 11 - Prob. 43CECh. 11 - Prob. 44CECh. 11 - Prob. 45CECh. 11 - Prob. 46CECh. 11 - Prob. 47DACh. 11 - Prob. 49DA
Knowledge Booster


Learn more about
Need a deep-dive on the concept behind this application? Look no further. Learn more about this topic, statistics and related others by exploring similar questions and additional content below.Similar questions
- A well-known company predominantly makes flat pack furniture for students. Variability with the automated machinery means the wood components are cut with a standard deviation in length of 0.45 mm. After they are cut the components are measured. If their length is more than 1.2 mm from the required length, the components are rejected. a) Calculate the percentage of components that get rejected. b) In a manufacturing run of 1000 units, how many are expected to be rejected? c) The company wishes to install more accurate equipment in order to reduce the rejection rate by one-half, using the same ±1.2mm rejection criterion. Calculate the maximum acceptable standard deviation of the new process.arrow_forward5. Let X and Y be independent random variables and let the superscripts denote symmetrization (recall Sect. 3.6). Show that (X + Y) X+ys.arrow_forward8. Suppose that the moments of the random variable X are constant, that is, suppose that EX" =c for all n ≥ 1, for some constant c. Find the distribution of X.arrow_forward
- 9. The concentration function of a random variable X is defined as Qx(h) = sup P(x ≤ X ≤x+h), h>0. Show that, if X and Y are independent random variables, then Qx+y (h) min{Qx(h). Qr (h)).arrow_forward10. Prove that, if (t)=1+0(12) as asf->> O is a characteristic function, then p = 1.arrow_forward9. The concentration function of a random variable X is defined as Qx(h) sup P(x ≤x≤x+h), h>0. (b) Is it true that Qx(ah) =aQx (h)?arrow_forward
- 3. Let X1, X2,..., X, be independent, Exp(1)-distributed random variables, and set V₁₁ = max Xk and W₁ = X₁+x+x+ Isk≤narrow_forward7. Consider the function (t)=(1+|t|)e, ER. (a) Prove that is a characteristic function. (b) Prove that the corresponding distribution is absolutely continuous. (c) Prove, departing from itself, that the distribution has finite mean and variance. (d) Prove, without computation, that the mean equals 0. (e) Compute the density.arrow_forward1. Show, by using characteristic, or moment generating functions, that if fx(x) = ½ex, -∞0 < x < ∞, then XY₁ - Y2, where Y₁ and Y2 are independent, exponentially distributed random variables.arrow_forward
- 1. Show, by using characteristic, or moment generating functions, that if 1 fx(x): x) = ½exarrow_forward1990) 02-02 50% mesob berceus +7 What's the probability of getting more than 1 head on 10 flips of a fair coin?arrow_forward9. The concentration function of a random variable X is defined as Qx(h) sup P(x≤x≤x+h), h>0. = x (a) Show that Qx+b(h) = Qx(h).arrow_forward
arrow_back_ios
SEE MORE QUESTIONS
arrow_forward_ios
Recommended textbooks for you
 Glencoe Algebra 1, Student Edition, 9780079039897...AlgebraISBN:9780079039897Author:CarterPublisher:McGraw Hill
 Big Ideas Math A Bridge To Success Algebra 1: Stu...AlgebraISBN:9781680331141Author:HOUGHTON MIFFLIN HARCOURTPublisher:Houghton Mifflin Harcourt
 Holt Mcdougal Larson Pre-algebra: Student Edition...AlgebraISBN:9780547587776Author:HOLT MCDOUGALPublisher:HOLT MCDOUGAL
 College Algebra (MindTap Course List)AlgebraISBN:9781305652231Author:R. David Gustafson, Jeff HughesPublisher:Cengage Learning
Glencoe Algebra 1, Student Edition, 9780079039897...
Algebra
ISBN:9780079039897
Author:Carter
Publisher:McGraw Hill
Big Ideas Math A Bridge To Success Algebra 1: Stu...
Algebra
ISBN:9781680331141
Author:HOUGHTON MIFFLIN HARCOURT
Publisher:Houghton Mifflin Harcourt
Holt Mcdougal Larson Pre-algebra: Student Edition...
Algebra
ISBN:9780547587776
Author:HOLT MCDOUGAL
Publisher:HOLT MCDOUGAL
College Algebra (MindTap Course List)
Algebra
ISBN:9781305652231
Author:R. David Gustafson, Jeff Hughes
Publisher:Cengage Learning
Hypothesis Testing using Confidence Interval Approach; Author: BUM2413 Applied Statistics UMP;https://www.youtube.com/watch?v=Hq1l3e9pLyY;License: Standard YouTube License, CC-BY
Hypothesis Testing - Difference of Two Means - Student's -Distribution & Normal Distribution; Author: The Organic Chemistry Tutor;https://www.youtube.com/watch?v=UcZwyzwWU7o;License: Standard Youtube License