Videos
Systematic versus Unsystematic Risk. Consider the following information on Stocks I and II:
The market risk premium is 7 percent, and the risk-free rate is 4 percent. Which stock has the most systematic risk? Which one has the most unsystematic risk? Which stock is “riskier”? Explain
To determine: The stock that has the most systematic risk and the most unsystematic risk.
Introduction:
Systematic risk refers to the market-specific risk that affects all the stocks in the market.
Unsystematic risk refers to the company-specific risk that affects only the individual company.
Explanation of Solution
Given information:
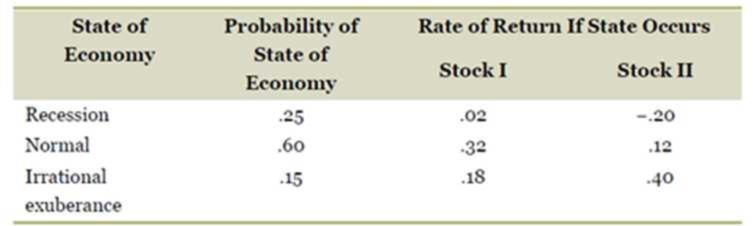
The probability of having a recession, normal economy, and irrational exuberance is 0.25, 0.60, and 0.15 respectively. Stock I will yield 2%, 32%, and 18% when there is a recession, normal economy, and irrational exuberance respectively.
Stock II will yield −20%, 12%, and 40% when there is a recession, normal economy, and irrational exuberance respectively. The market risk premium is 7% and the risk-free rate is 4%.
The formula to calculate the expected return on the stock:
The formula to calculate the beta of the stock:
Where,
E(Ri) refers to the expected return on a risky asset
Rf refers to the risk-free rate
E(RM) refers to the expected return on the market portfolio
βi refers to the beta coefficient of the risky asset relative to the market portfolio
The formula to calculate the standard deviation:
Compute the expected return on Stock I:
R1 is the returns during the recession. The probability of having a recession is P1. Similarly, R2 is the returns in a normal economy. The probability of having a normal is P2. R3 is the returns in irrational exuberance. The probability of having an irrational exuberance is P3.
Hence, the expected return on Stock I is 0.2240 or 22.40 percent.
Compute the beta of Stock I:
Hence, the beta of Stock I is 2.63.
Compute the standard deviation of Stock I:
R1 is the returns during the recession. The probability of having a recession is P1. Similarly, R2 is the returns in a normal economy. The probability of having a normal is P2. R3 is the returns in irrational exuberance. The probability of having an irrational exuberance is P3.
Hence, the standard deviation of Stock I is 0.1274 or 12.74%.
Compute the expected return on Stock II:
R1 is the returns during the recession. The probability of having a recession is P1. Similarly, R2 is the returns in a normal economy. The probability of having a normal is P2. R3 is the returns in irrational exuberance. The probability of having an irrational exuberance is P3.
Hence, the expected return on Stock II is 0.0820 or 8.20 percent.
Compute the beta of Stock II:
Hence, the beta of Stock II is 0.6.
Compute the standard deviation of Stock II:
R1 is the returns during the recession. The probability of having a recession is P1. Similarly, R2 is the returns in a normal economy. The probability of having a normal is P2. R3 is the returns in irrational exuberance. The probability of having an irrational exuberance is P3.
Hence, the standard deviation of Stock II is 0.1895 or 18.95%.
Interpretation:
The beta refers to the systematic risk of the stock. Stock I has higher beta than Stock II. Hence, the systematic risk of Stock I is higher.
The standard deviation indicates the total risk of the stock. The standard deviation is high for Stock II despite having a low beta. Hence, a major portion of the standard deviation of Stock II is the unsystematic risk. Therefore, Stock II has higher unsystematic risk than Stock I.
To discuss: The riskier Stock among Stock I and Stock II.
Introduction:
Risk refers to the movement or fluctuation in the value of an investment. The movement can be positive or negative. A positive fluctuation in the price benefits the investor. The investor will lose money if the price movement is negative.
Explanation of Solution
The formation of a portfolio helps in diversifying the unsystematic risk. Although, the Stock II has a higher unsystematic risk, it can be diversified completely. However, the beta cannot be eliminated. Hence, the Stock I is riskier than Stock II.
Want to see more full solutions like this?
Chapter 11 Solutions
ESSENTIALS CORPORATE FINANCE + CNCT A.


- The current NPV of a $30 million bond with 9% interest, 8% coupon rate, and discounted at $95arrow_forwardCould you please help to explain the DMAIC phases and how a researcher would use them to conduct a consulting project? What is a measure process performance and how to analyze the process? What is an improve process performance and how the control improves process and future process performance?arrow_forwardConsider the two stocks below. Graph the frontier of combinations of the two stocks. Show the effect on the frontier of varying the correlation from −1 to +1. 1 2 3 Mean A B C D TWO STOCKS Varying the correlation coefficient Stock A Stock B 3.00% 8.00% 4 Sigma 15.00% 22.00% 5 Correlation 0.3000 Farrow_forward
- Lindsay is 30 years old and has a new job in web development. She wants to make sure that she is financially sound by the age of 55, so she plans to invest the same amount into a retirement account at the end of every year for the next 25 years. (a) Construct a data table in Excel that will show Lindsay the balance of her retirement account for various levels of annual investment and return. If Lindsay invests $10,000 at return of 6%, what would be the balance at the end of the 25th year? Note that because Lindsay invests at the end of the year, there is no interest earned on the contribution for the year in which she contributes. Round your answer to a whole dollar amount. $ (b) Develop a two-way table for annual investment amounts of $5,000 to $20,000 in increments of $1,000 and for returns of 0% to 12% in increments of 1%. From the 2-way table, what are the minimum annual investments Lindsay must contribute for annual rates ranging from 6% to 11%, if she wants to…arrow_forwardDoes Airbnb have any impaired assets? If so, what are they?arrow_forward1. Consider two assets with the following returns: State Prob. of state R1 R2 1 2/3 .03 .05 2 1/3 .09 .02arrow_forward
- Bright wood! Seating sells reclining chairs for $55.00 per unit. The variable cost is 322 per unit. Each reclining chair requires 5 direct labor hours and 3 machine hours to produce. ibution margin pemachine hon Wrightwood Manufacturing has a break-even point of 1,500 units. The sales price per unit is $18. and the variable cost per us $13. If the company sells 3,500 units, what will its net income be? Crestwood Industries provides the following budget data for its Processing Department for the year 2022: ⚫ Manufacturing Overhead Costs=250 ⚫ Direct Labor Costs $1,234,500 Determine the manufacturing overhead application rate under the base of Direct Labor Costs. Modesto Accessories manufactures two types of wallets leather and canvas. The company allocates manufacturing overhead using a single plant wide rate with direct labor cost as the allocation base. $48 Estimated Overhead Costs = 30,600 Direct Labor Cost per Leather Wallet Direct Labor Cost per Canvas Wallet = $52 Number of…arrow_forwardNo Aiarrow_forwardNo aiarrow_forward
- List and discuss the various values for bonds discussed in the chapter. Additionally, explain in detail what is meant by "Yield to Maturity".arrow_forwardProvide Answer of This Financial Accounting Question And Please Don't Use Ai Becouse In all Ai give Wrong Answer. And Provide All Question Answer If you will use AI will give unhelpful.arrow_forwardYou plan to save $X per year for 6 years, with your first savings contribution in 1 year. You and your heirs then plan to withdraw $43,246 per year forever, with your first withdrawal expected in 7 years. What is X if the expected return per year is 18.15 percent per year? Input instructions: Round your answer to the nearest dollar. 59 $arrow_forward
 Pfin (with Mindtap, 1 Term Printed Access Card) (...FinanceISBN:9780357033609Author:Randall Billingsley, Lawrence J. Gitman, Michael D. JoehnkPublisher:Cengage Learning
 EBK CONTEMPORARY FINANCIAL MANAGEMENTFinanceISBN:9781337514835Author:MOYERPublisher:CENGAGE LEARNING - CONSIGNMENT
 Intermediate Financial Management (MindTap Course...FinanceISBN:9781337395083Author:Eugene F. Brigham, Phillip R. DavesPublisher:Cengage Learning