
Concept explainers
Videos
Tom Sevits is the owner of the Appliance Patch. Recently Tom observed a difference in the dollar value of sales between the men and women he employs as sales associates. A sample of 40 days revealed the men sold a mean of $1,400 worth of appliances per day. For a sample of 50 days, the women sold a mean of $1,500 worth of appliances per day. Assume the population standard deviation for men is $200 and for women $250. At the .05 significance level, can Mr. Sevits conclude that the mean amount sold per day is larger for the women?
- (a) State the null hypothesis and the alternate hypothesis.
- (b) What is the decision rule?
- (c) What is the value of the test statistic?
- (d) What is your decision regarding the null hypothesis?
- (e) What is the p-value?
- (f) Interpret the result.
a.
State the null and the alternative hypothesis.
Answer to Problem 1SR
The null hypothesis is
The alternative hypothesis is
Explanation of Solution
In this context,
The hypotheses are given below:
Null hypothesis:
Alternative hypothesis:
Thus, the null hypothesis is
b.
Determine the decision rule.
Explanation of Solution
Step-by-step procedure to obtain the critical value using MINITAB software:
- Choose Graph > Probability Distribution Plot choose View Probability> OK.
- From Distribution, choose ‘Normal’ distribution.
- Enter the Mean as 0 and Standard deviation value as 1
- Click the Shaded Area tab.
- Choose Probability and Right Tails for the region of the curve to shade.
- Enter the probability value as 0.05.
- Click OK.
Output obtained using MINITAB software is given below:
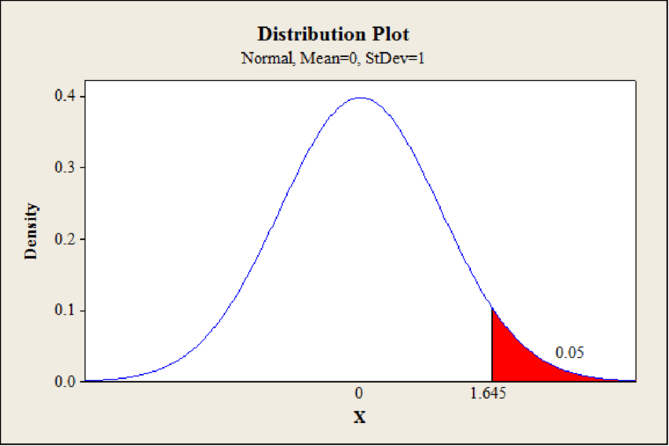
From the MINITAB output, the critical value is 1.645.
The decision rule is as follows:
If
c.
Find the value of the test statistics.
Answer to Problem 1SR
The value of the test statistics is 2.108.
Explanation of Solution
The test statistics is obtained as follows:
Thus, the value of test statistics is 2.108.
d.
Determine the decision regarding
Answer to Problem 1SR
The decision is that reject the null hypothesis
Explanation of Solution
Decision:
The critical value is 1.645 and the value of test statistic is 2.108.
The value of test statistic is greater than the critical value.
That is,
From the decision rule, reject the null hypothesis.
e.
Find the p-value.
Answer to Problem 1SR
The p-value is 0.0175.
Explanation of Solution
p-value:
Step-by-step procedure to obtain the p-value using MINITAB software:
- Choose Graph > Probability Distribution Plot choose View Probability> OK.
- From Distribution, choose ‘Normal’ distribution.
- Enter the Mean as 0 and Standard deviation value as 1.
- Click the Shaded Area tab.
- Choose X Value and right tails for the region of the curve to shade.
- Enter the X value as 2.108.
- Click OK.
Output obtained using MINITAB software is given below:
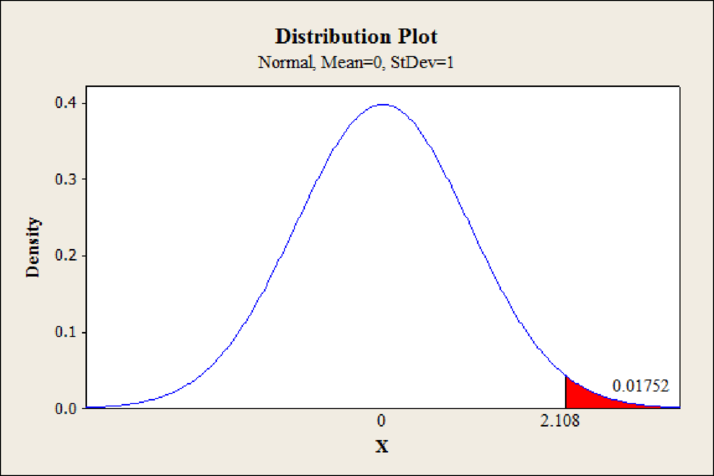
From the MINITAB output, the p-value is 0.0175.
Thus, the p-value is 0.0175.
f.
Interpret the result.
Explanation of Solution
Interpretation:
Here, the null hypothesis is rejected.
Therefore, there is evidence that the mean amount of sales per day by woman is greater than that of women.
Want to see more full solutions like this?
Chapter 11 Solutions
EBK STATISTICAL TECHNIQUES IN BUSINESS


- Suppose that you take a sample of 100 from a population that contains 45 percent Democrats. What sample size condition do you need to check here (if any)?What’s the standard error of ^P?Compare the standard errors of ^p n=100 for ,n=1000 , n=10,000, and comment.arrow_forwardSuppose that a class’s test scores have a mean of 80 and standard deviation of 5. You choose 25 students from the class. What’s the chance that the group’s average test score is more than 82?arrow_forwardSuppose that you collect data on 10 products and check their weights. The average should be 10 ounces, but your sample mean is 9 ounces with standard deviation 2 ounces. Find the standard score.What percentile is the standard score found in part a of this question closest to?Suppose that the mean really is 10 ounces. Do you find these results unusual? Use probabilities to explain.arrow_forward
- Suppose that you want to sample expensive computer chips, but you can have only n=3 of them. Should you continue the experiment?arrow_forwardSuppose that studies claim that 40 percent of cellphone owners use their phones in the car while driving. What’s the chance that more than 425 out of a random sample of 1,000 cellphone owners say they use their phones while driving?arrow_forwardSuppose that the average length of stay in Europe for American tourists is 17 days, with standard deviation 4.5. You choose a random sample of 16 American tourists. The sample of 16 stay an average of 18.5 days or more. What’s the chance of that happening?arrow_forward
- How do you recognize that a statistical problem requires you to use the CLT? Think of one or two clues you can look for. (Assume quantitative data.)arrow_forwardSuppose that you take a sample of 100 from a skewed population with mean 50 and standard deviation 15. What sample size condition do you need to check here (if any)?What’s the shape and center of the sampling distribution for ?What’s the standard error?arrow_forwardQuestion 3 The following stem-and-leaf displays the weekly salary of employees at this firm. Stem-and-Leaf Display Leaf Unit = 10.0 N=x 5 3 00123 12 4 0125888 (y) 5 11234456777 z 6 13568 5 7 154 2 8 46 i. Determine the value of x, y and z. [3] ii. What is the value of the median? [2] iii. Find the mode of this data set. iv. Calculate the range [1] [2]arrow_forward
- Let Y be a continuous RV with PDF otherwise Find the CDF, Fry), of Y . Find an expression for pth, p € (0, 1), quantile of the distribution. Find E(Y) and V(Y). Find E(-2Y + 1) and V(-3Y - 2). Find E(Y3).arrow_forwardLet X be a continuous RV with CDF Find P(X < 0), P(-1 < X < 1) and P(0.5 < X). Based on your answers to the above questions, what is the median of the distribu-tion? Why Find the PDF, fx (x), of X.arrow_forwardA survey of 581 citizens found that 313 of them favor a new bill introduced by the city. We want to find a 95% confidence interval for the true proportion of the population who favor the bill. What is the lower limit of the interval? Enter the result as a decimal rounded to 3 decimal digits. Your Answer:arrow_forward
 Big Ideas Math A Bridge To Success Algebra 1: Stu...AlgebraISBN:9781680331141Author:HOUGHTON MIFFLIN HARCOURTPublisher:Houghton Mifflin Harcourt
 Glencoe Algebra 1, Student Edition, 9780079039897...AlgebraISBN:9780079039897Author:CarterPublisher:McGraw Hill