Concept explainers
Videos
FROM DATA TO DECISION
Critical Thinking: Was Allstate wrong?
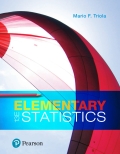
The Allstate insurance company once issued a press release listing zodiac signs along with the corresponding numbers of automobile crashes, as shown in the first and last columns in the table below.
In the original press release. Allstate included comments such as one stating that Virgos are worried and shy, and they were involved in 211,650 accidents, making them the worst offenders. Allstate quickly issued an apology and retraction. In a press release. Allstate included this: “Astrological signs have absolutely no role in how we base coverage and set rates. Rating by astrology would not be actuarially sound.”
Analyzing the Results
The original Allstate press release did not include the lengths (days) of the different zodiac signs. The preceding table lists those lengths in the third column. A reasonable explanation for the different numbers of crashes is that they should he proportional to the lengths of the zodiac signs. For example, people are born under the Capricorn sign on 29 days out of the 365 days in the year, so they are expected to have 29/365 of the total number of crashes. Use the methods of this chapter to determine whether this appears to explain the results in the table. Write a brief report of your findings.
Want to see the full answer?
Check out a sample textbook solution
Chapter 11 Solutions
Elementary Statistics (13th Edition)


- 14 Is the standard deviation affected by skewed data? If so, how? foldarrow_forwardFrequency 15 Suppose that your friend believes his gambling partner plays with a loaded die (not fair). He shows you a graph of the outcomes of the games played with this die (see the following figure). Based on this graph, do you agree with this person? Why or why not? 65 Single Die Outcomes: Graph 1 60 55 50 45 40 1 2 3 4 Outcome 55 6arrow_forwardlie y H 16 The first month's telephone bills for new customers of a certain phone company are shown in the following figure. The histogram showing the bills is misleading, however. Explain why, and suggest a solution. Frequency 140 120 100 80 60 40 20 0 0 20 40 60 80 Telephone Bill ($) 100 120arrow_forward
- 25 ptical rule applies because t Does the empirical rule apply to the data set shown in the following figure? Explain. 2 6 5 Frequency 3 сл 2 1 0 2 4 6 8 00arrow_forward24 Line graphs typically connect the dots that represent the data values over time. If the time increments between the dots are large, explain why the line graph can be somewhat misleading.arrow_forward17 Make a box plot from the five-number summary: 3, 4, 7, 16, 17. 992) waarrow_forward
- 12 10 - 8 6 4 29 0 Interpret the shape, center and spread of the following box plot. brill smo slob.nl bagharrow_forwardSuppose that a driver's test has a mean score of 7 (out of 10 points) and standard deviation 0.5. a. Explain why you can reasonably assume that the data set of the test scores is mound-shaped. b. For the drivers taking this particular test, where should 68 percent of them score? c. Where should 95 percent of them score? d. Where should 99.7 percent of them score? Sarrow_forward13 Can the mean of a data set be higher than most of the values in the set? If so, how? Can the median of a set be higher than most of the values? If so, how? srit to estaarrow_forward
- A random variable X takes values 0 and 1 with probabilities q and p, respectively, with q+p=1. find the moment generating function of X and show that all the moments about the origin equal p. (Note- Please include as much detailed solution/steps in the solution to understand, Thank you!)arrow_forward1 (Expected Shortfall) Suppose the price of an asset Pt follows a normal random walk, i.e., Pt = Po+r₁ + ... + rt with r₁, r2,... being IID N(μ, o²). Po+r1+. ⚫ Suppose the VaR of rt is VaRq(rt) at level q, find the VaR of the price in T days, i.e., VaRq(Pt – Pt–T). - • If ESq(rt) = A, find ES₁(Pt – Pt–T).arrow_forward2 (Normal Distribution) Let rt be a log return. Suppose that r₁, 2, ... are IID N(0.06, 0.47). What is the distribution of rt (4) = rt + rt-1 + rt-2 + rt-3? What is P(rt (4) < 2)? What is the covariance between r2(2) = 1 + 12 and 13(2) = r² + 13? • What is the conditional distribution of r₁(3) = rt + rt-1 + rt-2 given rt-2 = 0.6?arrow_forward
 Glencoe Algebra 1, Student Edition, 9780079039897...AlgebraISBN:9780079039897Author:CarterPublisher:McGraw Hill
 Holt Mcdougal Larson Pre-algebra: Student Edition...AlgebraISBN:9780547587776Author:HOLT MCDOUGALPublisher:HOLT MCDOUGAL