
Concept explainers
Videos
Complete the following concept map to test your knowledge of gene regulation.
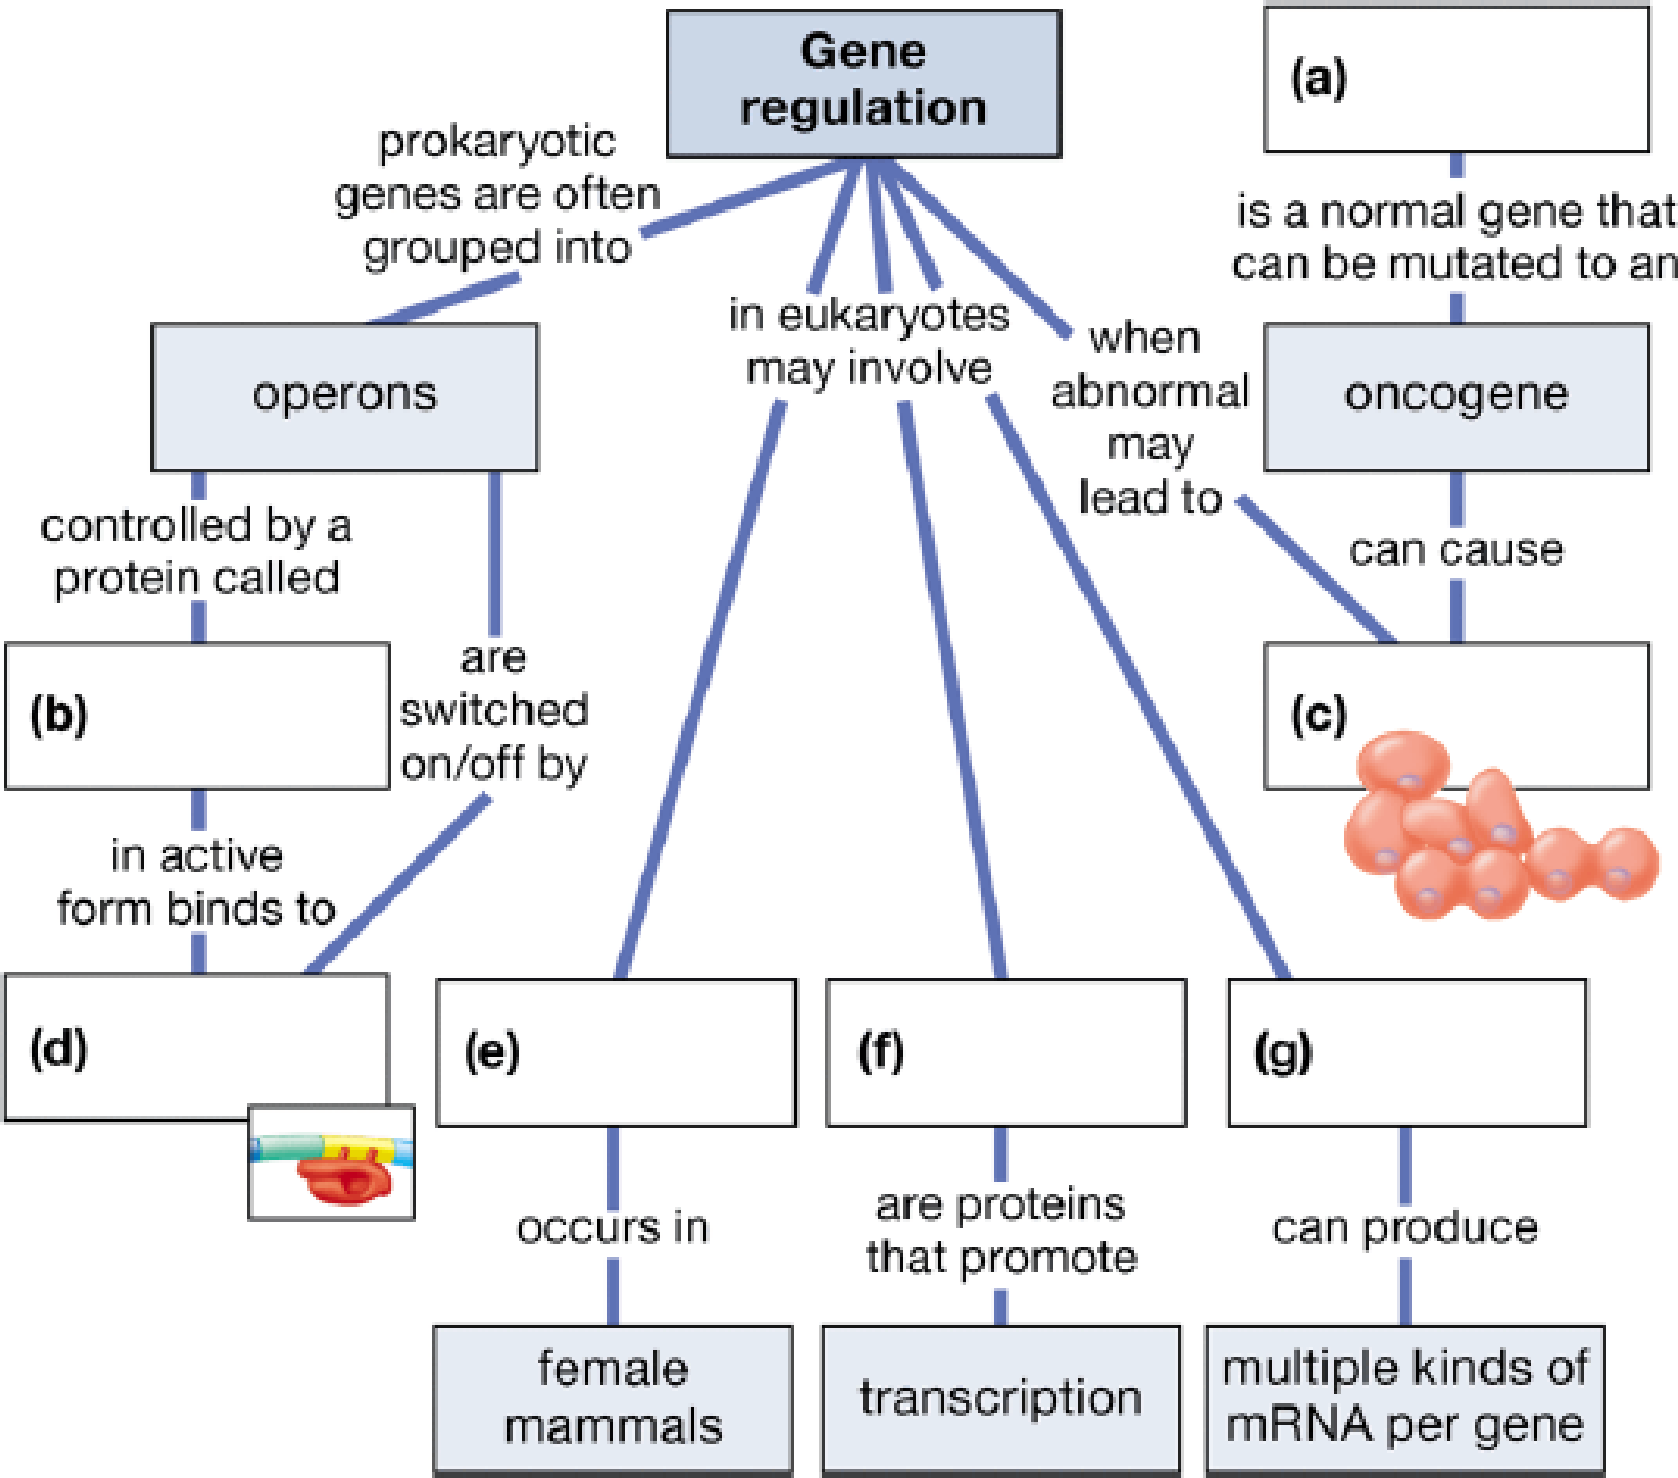
To complete: The given map showing a process of gene regulation.
Introduction: Gene regulation is a process where the expression of genes are controlled for the synthesis of specified gene products (usually RNA or proteins).
Answer to Problem 1CC
Pictorial representation: Figure 1 shows the completed map of the gene regulation in prokaryotes and eukaryotes.
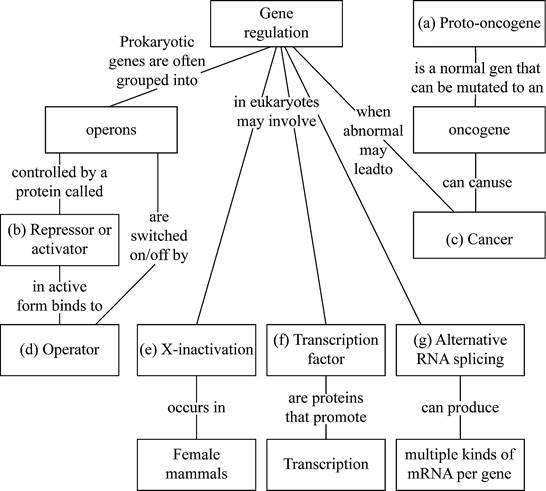
Fig. 1: Gene regulation in prokaryotes and eukaryotes
Explanation of Solution
(a)
Correct answer: Proto-oncogenes.
Explanation: Proto-oncogenes are the common genes which are transformed into oncogenes (malignant genes) during mutation. These mutations can lead to indefinite proliferation of cells.
(b)
Correct answer: Repressor or activator.
Explanation: They are the molecules which regulates the transcription. Activators are transcription factors that activate or boost a gene to express and the repressors are the molecules that stop the expression of a gene.
(c)
Correct answer: Cancer.
Explanation: Cancer is a diseased condition where the normal cells get converted to abnormal cells through undifferentiated and uncontrolled growth.
(d)
Correct answer: Operator.
Explanation: Operator is a part of the operons which regulates the binding of a repressor molecule to it. The transcription is stopped when the repressor binds to the operator, thereby it blocks the further binding of RNA polymerase to initiate the transcription.
(e)
Correct answer: X-inactivation.
Explanation: The process of inactivation of single copy of X chromosomes in female mammals is called as X-inactivation.
(f)
Correct answer: Transcription factors.
Explanation: The proteins that are associated with the transcription of DNA to mRNA are called as transcription.
(g)
Correct answer: Alternative RNA splicing.
Explanation: Alternative splicing (differential splicing) is the process of regulation during a gene expression to produce a single gene which can code for different proteins. Final product of alternative splicing will be a processed mRNA.
Want to see more full solutions like this?
Chapter 11 Solutions
Campbell Biology: Concepts and Connections


- There is a patient with breast cancer, after staining the breast tissue with H&E, state the molecular subtype of the tumour extracted. Results of H&E staining are down belowarrow_forwardBiopharmaceutics and Pharmacokinetics:Two-Compartment Model Instant Absorption Questions Calculate these : a) B1, b) B2, c) hybrid rate constant (1) d) hybrid rate constant (2) e) t1/2,dist f) t1/2,elim g) k10 h) k12 i) k21 j) initial concentration (C0) k) central compartment volume (V1) l) steady-state volume (Vss) m) clearance (CL) AUC (0→10 min) using trapezoidal rule n) AUC (20→30 min) using trapezoidal rule o) AUCtail (AUC360→∞) p) total AUC (using short cut method) q) volume from AUC (VAUC)arrow_forwardUse the Henderson-Hasselbalch equation for a propanoic acid solution (CH₂CH₂CO₂H, pK₁ = 4.874) to calculate the quotient [A-]/[HA] at three different pH values. pH = 4.479 [A-] [HA] [A-] pH = 4.874 [HA] = pH = 5.220 [A-] = [HA]arrow_forward
- In order to establish the expiration date of perishable food, growth curve data must be collected. Once the microbial load is so high that it poses a hazard to human health, the food item is no longer considered safe (expired). Generally a load of x50,000 bacteria/gram is considered unsafe. Your task is to determine the microbial growth curves for MicroYo, a new brand of yogurt. The growth is determined by sampling the yogurt and growing the bacterial isolates in broth culture which is then serially diluted by a total of x10,000 and inoculated onto standard petri plates of nutrient agar. The following colony counts are measured: Time (days) MicroYo colony count# 1 1 4 1 12 2 16 20 4 7 What day should you recommend expiring the yogurt (the last possible date before the microbial load is unsafe). 12 4 20 16arrow_forward9. Chicken combs in chickens is an example where you see interactions between genes. See potential genotypes and phenotypes below. Which genotype, when mated to a rose comb chicken, will produce progeny that are 50% walnut comb and 50% pea comb? walnut (RRPP) walnut (RrPP) pea (rrPP) walnut (RRPP) walnut (RrPp) pea (rrPp) rose rose single (RRPP) (Rrpp) (rrpp)arrow_forwardDescribe a compound light microscope and its importance in microbiology (2) examples of at least two microbes viewed under a compound light microscope and their general characteristics (note: the microbes you choose do not need to be the ones outlined in the above tutorial video) and (3) at least one source you used for the information included in your infographic.arrow_forward
- Price of visit Number of visits $700 0 $600 [1 $500 2 $400 3 $300 4 00000 The Table blow gives the demand curve for doctor visits for Elena. If the price of a doctor's visit is $600, and Elena does not have health insurance, she will visit the doctor times. If Elena obtains 50% coinsurance (the company pays 50% of the medical bill, Elena pays 50%), then Elena will visit the doctor times. 1; 2 0; 3 0; 2 1;4 2; 1arrow_forwardP 200 150- 100 50 w/instrance/ w/insurance 2 100 Demand Assume that the white curve (labeled "Demand") represents an individual's true demand for this particular health care service. The coinsurance associated with insurance option 1 (in blue) is likely _. 0000 100% 25% 50% 0%arrow_forwardUse the figure below. Bob and Nancy have the same income and total utility.. willingness to pay for an insurance premium will be lower than because they are. risk- averse. Total utility Current utility Bob's utility Nancy's utility 0000 Bob; Nancy; less Nancy; Bob; less Nancy; Bob; more Bob; Nancy; more Current Income incomearrow_forward
- Consider the figure below. Suppose the true price of a health care service is P1. Suppose further that the individual has obtained insurance that has a fixed copayment for this particular service. The copayment is represented by price P2. represents the quantity of the service the individual would consume without insurance. quantity of the service the individual would consume with the insurance. Health Care Service represents the P. P₂ a Q1;Q2 Q2; Q3 Q1; Q3 Q3; Q1 Q2; Q1 फ f Q ८ g d h Q3\D 7Q 00000arrow_forwardThe table shows the utility Jordan receives at various income levels, but they do not know what their income will be next year. There is a 15% chance their income will be $25,000, a 20% chance their income will be $35,000, and a 65% chance their income will be $45,000. We know that Jordan is Income $25,000 Utility 2,800 30,000 3,200 35,000 3,500 40,000 3,700 45,000 3,800 ☐ none of the above 0 000 risk taker (lover) because their marginal utility of income is increasing risk neutral because their marginal utility of income is constant risk averse because their marginal utility of income is decreasing risk neutral because their marginal utility of income is decreasingarrow_forwardOOOO a d+e d a+b+c Consider the figure below. Suppose the true price of a health care service is P1. Suppose further that the individual has obtained insurance that has a fixed copayment for this particular service. The copayment is represented by price P2. The social loss from moral hazard if the individual has copayment P2 is represented graphically by the area(s): Health Care Service P. a No 4 ८ e g Q2 Q3 Darrow_forward

 Human Heredity: Principles and Issues (MindTap Co...BiologyISBN:9781305251052Author:Michael CummingsPublisher:Cengage Learning
 Biology (MindTap Course List)BiologyISBN:9781337392938Author:Eldra Solomon, Charles Martin, Diana W. Martin, Linda R. BergPublisher:Cengage Learning
 Concepts of BiologyBiologyISBN:9781938168116Author:Samantha Fowler, Rebecca Roush, James WisePublisher:OpenStax College
 Human Biology (MindTap Course List)BiologyISBN:9781305112100Author:Cecie Starr, Beverly McMillanPublisher:Cengage Learning
 Biology: The Dynamic Science (MindTap Course List)BiologyISBN:9781305389892Author:Peter J. Russell, Paul E. Hertz, Beverly McMillanPublisher:Cengage Learning