
Subpart (a):
The graphical illustration for the changes in
Subpart (a):
Explanation of Solution
Figure 1 shows the shift in the supply curve of labor force.

In Figure 1, the vertical axis measures the
Concept introduction:
Aggregate Supply (AS): Aggregate supply refers to the total value of the goods and the services available for purchase at a particular price in a given period of time.
Subpart (b):
The graphical illustration for the changes in aggregate supply.
Subpart (b):
Explanation of Solution
Figure 2 shows the changes in the aggregate supply curve of capital.
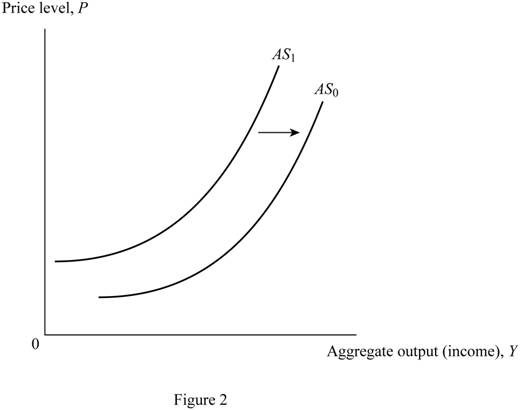
In Figure 2, the vertical axis measures the price level and the horizontal axis measures the aggregate output. The upward sloping curves AS0 and AS1 are aggregate supply curves. The increase in available capital increases the supply of capital in the market. It shifts the supply curve from AS1 to AS0.
Concept introduction:
Aggregate Supply (AS): Aggregate supply refers to the total value of the goods and services available for purchase at a particular price in a given period of time.
Subpart (c):
The graphical illustration for the changes in aggregate supply.
Subpart (c):
Explanation of Solution
Figure 3 shows the changes in aggregate supply curve.

In Figure 3, the vertical axis measures the price level and the horizontal axis measures the aggregate output. The upward sloping curves AS0 and AS1 are aggregate supply curves. An increase in the productivity, as a result of a technological change, shifts the aggregate supply curve to the right (from AS1 to AS0).
Concept introduction:
Aggregate Supply (AS): Aggregate supply refers to the total value of the goods and services available for purchase at a particular price in a given period of time.
Subpart (d):
The graphical illustration for the changes in aggregate supply curve.
Subpart (d):
Explanation of Solution
Figure 4 shows the changes in aggregate supply curve.
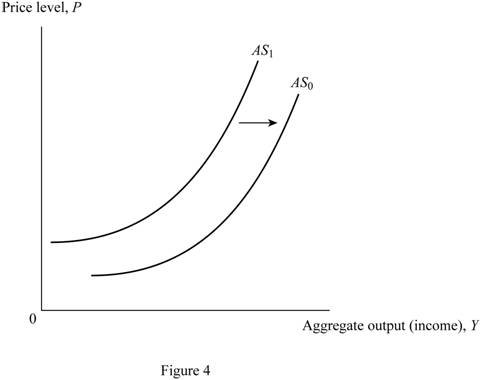
In Figure 4, the vertical axis measures the price level and the horizontal axis measures the aggregate output. The upward sloping curves AS0 and AS1 are aggregate supply curves. The increase in the price of oil increases the supply of oil in the market. It shifts the aggregate supply curve rightward (from AS1 to AS0).
Concept introduction:
Aggregate Supply (AS): Aggregate supply refers to the total value of the goods and services available for purchase at a particular price in a given period of time.
Want to see more full solutions like this?
Chapter 11 Solutions
Principles of Macroeconomics, Student Value Edition Plus MyLab Economics with Pearson eText -- Access Card Package (12th Edition)

- check if my answers are right for the questions and draw the graphs for me pleasearrow_forwardcheck my answers and draw the graph for me.arrow_forwardThe first question, the drop down options are: the US, Canada, and Mexico The second question, the drop down options are: the US, Canada, and Mexico The last two questions are explained in the photo.arrow_forward
- Respond to isaiah Great day everyone and welcome to week 6! Every time we start to have fun, the government ruins it! The success of your business due to the strong economy explains why my spouse feels excited. The increase in interest rates may lead to a decline in new home demand. When mortgage rates rise they lead to higher costs which can discourage potential buyers and reduce demand in the housing market. The government increases interest rates as a measure to suppress inflation and stop the economy from growing too fast. Business expansion during this period presents significant risks. Before making significant investments it would be prudent to monitor how the market responds to the rate increase. Business expansion during a decline in demand for new homes could create financial difficulties.arrow_forwardPlace the labeled CS to represent the new consumer surplus in the market and the area labeled PS to represent producer surplusarrow_forwardNot use ai pleasearrow_forward
 Macroeconomics: Private and Public Choice (MindTa...EconomicsISBN:9781305506756Author:James D. Gwartney, Richard L. Stroup, Russell S. Sobel, David A. MacphersonPublisher:Cengage Learning
 Economics: Private and Public Choice (MindTap Cou...EconomicsISBN:9781305506725Author:James D. Gwartney, Richard L. Stroup, Russell S. Sobel, David A. MacphersonPublisher:Cengage Learning
 Economics (MindTap Course List)EconomicsISBN:9781337617383Author:Roger A. ArnoldPublisher:Cengage Learning

 Essentials of Economics (MindTap Course List)EconomicsISBN:9781337091992Author:N. Gregory MankiwPublisher:Cengage Learning