
Concept explainers
Videos
For Exercises 1 through 10, follow these steps.
a. State the hypotheses and identify the claim.
b. Find the critical value(s).
c. Compute the test value.
d. Make the decision.
e. Summarize the results.
Use the traditional method of hypothesis testing unless otherwise specified. Assume all assumptions have been met.
1. Traffic Accident Fatalities A traffic safety report indicated that for the 21–24 year age group, 31.58% of traffic fatalities were victims who had used a seat belt. Victims who were not wearing a seat belt accounted for 59.83% of the deaths, and the status of the rest was unknown. A study of 120 randomly selected traffic fatalities in a particular region showed that for this age group, 35 of the victims had used a seat belt, 78 had not, and the status of the rest was unknown. At α = 0.05, is there sufficient evidence that the proportions differ from those in the report?
Source: New York Times Almanac.
(a)
To state: The hypothesis and the claim.
Answer to Problem 11.1.1RE
The null and alternative hypotheses are:
And the claim of the test is the observed proportion is different from the reported proportion.
Explanation of Solution
Given info:
The percentage of death and the observed count corresponding to each reason are provided in the question. The level of significance is
Justification:
The researcher wants to know that whether the proportion of the traffic fatalities corresponding to each reason is different from the reported proportion or not. The null and alternative hypothesis can be defined as:
Null hypothesis:
Alternative hypothesis:
In the provided situation, the claim of the study will be the observed proportion corresponding to each reason is different from the reported proportion.
(b)
The critical value.
Answer to Problem 11.1.1RE
The required critical value is 5.991.
Explanation of Solution
The required critical value is obtained from the provided chi-square table in the textbook. The number of categories is 3.
The degrees of freedom is calculated as:
Therefore, the critical value at
(c)
The value of the test statistic.
Answer to Problem 11.1.1RE
The test statistic value is 1.819.
Explanation of Solution
Calculation:
Software procedure:
Step-by-step procedure to obtain the test statistic using the MINITAB software:
- Enter the data in the Minitab worksheet.
- Go to Stat> Tables> Chi-Square Goodness-of-Fit Test (one variable).
- Specify the “Observed count”, choose the option “Proportions specified by historic count”, and specify the column where the percentage is written.
- Click on OK.
Output using the MINITAB software is given below:
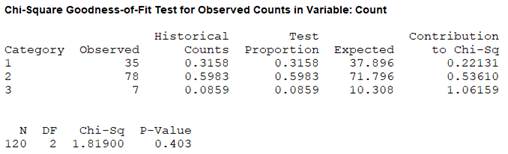
Therefore, the obtained value of the test statistic is 1.819.
(d)
To make: The decision.
Answer to Problem 11.1.1RE
The null hypothesis will not be rejected.
Explanation of Solution
The obtained value of the test statistic is 1.819 and the critical value is 5.991. As the obtained value of the chi-square statistic is less than the critical value, it can be said that there is not enough evidence to reject the null hypothesis at
(e)
To summarize: The results.
Answer to Problem 11.1.1RE
According to the obtained result, the claim of the study is not true.
Explanation of Solution
The null hypothesis is not rejected. On the basis of the obtained result, it can be concluded that the result of the proportion of the traffic fatalities is not different from the reported proportion at
Want to see more full solutions like this?
Chapter 11 Solutions
Elementary Statistics: A Step By Step Approach


- Examine the Variables: Carefully review and note the names of all variables in the dataset. Examples of these variables include: Mileage (mpg) Number of Cylinders (cyl) Displacement (disp) Horsepower (hp) Research: Google to understand these variables. Statistical Analysis: Select mpg variable, and perform the following statistical tests. Once you are done with these tests using mpg variable, repeat the same with hp Mean Median First Quartile (Q1) Second Quartile (Q2) Third Quartile (Q3) Fourth Quartile (Q4) 10th Percentile 70th Percentile Skewness Kurtosis Document Your Results: In RStudio: Before running each statistical test, provide a heading in the format shown at the bottom. “# Mean of mileage – Your name’s command” In Microsoft Word: Once you've completed all tests, take a screenshot of your results in RStudio and paste it into a Microsoft Word document. Make sure that snapshots are very clear. You will need multiple snapshots. Also transfer these results to the…arrow_forward2 (VaR and ES) Suppose X1 are independent. Prove that ~ Unif[-0.5, 0.5] and X2 VaRa (X1X2) < VaRa(X1) + VaRa (X2). ~ Unif[-0.5, 0.5]arrow_forward8 (Correlation and Diversification) Assume we have two stocks, A and B, show that a particular combination of the two stocks produce a risk-free portfolio when the correlation between the return of A and B is -1.arrow_forward
- 9 (Portfolio allocation) Suppose R₁ and R2 are returns of 2 assets and with expected return and variance respectively r₁ and 72 and variance-covariance σ2, 0%½ and σ12. Find −∞ ≤ w ≤ ∞ such that the portfolio wR₁ + (1 - w) R₂ has the smallest risk.arrow_forward7 (Multivariate random variable) Suppose X, €1, €2, €3 are IID N(0, 1) and Y2 Y₁ = 0.2 0.8X + €1, Y₂ = 0.3 +0.7X+ €2, Y3 = 0.2 + 0.9X + €3. = (In models like this, X is called the common factors of Y₁, Y₂, Y3.) Y = (Y1, Y2, Y3). (a) Find E(Y) and cov(Y). (b) What can you observe from cov(Y). Writearrow_forward1 (VaR and ES) Suppose X ~ f(x) with 1+x, if 0> x > −1 f(x) = 1−x if 1 x > 0 Find VaRo.05 (X) and ES0.05 (X).arrow_forward
- Joy is making Christmas gifts. She has 6 1/12 feet of yarn and will need 4 1/4 to complete our project. How much yarn will she have left over compute this solution in two different ways arrow_forwardSolve for X. Explain each step. 2^2x • 2^-4=8arrow_forwardOne hundred people were surveyed, and one question pertained to their educational background. The results of this question and their genders are given in the following table. Female (F) Male (F′) Total College degree (D) 30 20 50 No college degree (D′) 30 20 50 Total 60 40 100 If a person is selected at random from those surveyed, find the probability of each of the following events.1. The person is female or has a college degree. Answer: equation editor Equation Editor 2. The person is male or does not have a college degree. Answer: equation editor Equation Editor 3. The person is female or does not have a college degree.arrow_forward
 Glencoe Algebra 1, Student Edition, 9780079039897...AlgebraISBN:9780079039897Author:CarterPublisher:McGraw Hill
 College Algebra (MindTap Course List)AlgebraISBN:9781305652231Author:R. David Gustafson, Jeff HughesPublisher:Cengage Learning
 Holt Mcdougal Larson Pre-algebra: Student Edition...AlgebraISBN:9780547587776Author:HOLT MCDOUGALPublisher:HOLT MCDOUGAL