Concept explainers
Videos
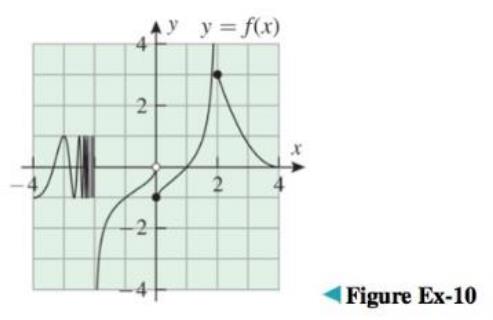
In these exercises, make reasonable assumptions about the graph of the indicated function outside of the region depicted.
For the function
(a)
(b)
(c)
(d)
(e)
(f)
(g) the vertical asymptotes of the graph of
Want to see the full answer?
Check out a sample textbook solution
Chapter 1 Solutions
Calculus Early Transcendentals, Binder Ready Version
Additional Math Textbook Solutions
Algebra and Trigonometry (6th Edition)
College Algebra with Modeling & Visualization (5th Edition)
Thinking Mathematically (6th Edition)
A Problem Solving Approach To Mathematics For Elementary School Teachers (13th Edition)


- Solve please and thank you!arrow_forwardSolve please and thanks!arrow_forwardThe graph of the function f in the figure below consists of line segments and a semicircle. Let g be the function given by x 9(x) = * f(t)dt. Determine all values of r, if any, where g has a relative minimum on the open interval (-9, 9). y 8 7 6 5 4 32 1 Graph of f x -10 -9 -8 -7 -6 -5 -4 -3 -2 -1 1 2 3 4 5 6 7 8 9 10 -1 -2 -3 -4 -5 -6 678 -7 -8arrow_forward
- Solve pleasearrow_forwardA particle moves along the x-axis for 0 < t < 18 such that its velocity is given by the graph shown below. Find the total distance traveled by the particle during the time interval 4 ≤ t ≤ 8. 8 y 7 6 5 4 32 1 6 7 -1 1 2 3 4 5 -1 -2 -3 -4 56 -6 -8 8 00 Graph of v(t) x 9 10 11 12 13 14 15 16 17 18 19arrow_forwardUsing the Chain rule please and thank youarrow_forward
- 10. [-/3 Points] DETAILS MY NOTES SESSCALCET2 7.2.047. Consider the following. aR- br (a) Set up an integral for the volume a solid torus (the donut-shaped solid shown in the figure) with radii br and aR. (Let a 8 and b = 2.) = dy (b) By interpreting the integral as an area, find the volume V of the torus. V = Need Help? Read It Watch Itarrow_forwardGraph y= log(x − 1) +4 10+ 9 8 7 6 5 4 32 1 10 -9 -8 -7 -6 -5 -4 -3 -2 -1 1 2 3 4 5 -1 6 7 8 9 10 -2 -3 -4 -5 -6 -7 -8 -9 -10arrow_forwardWrite an equation for the graph shown below. 5 4 3 2 1 -5-4-3-2-1 -1 1 2 3 4 5 f(x) = -2 -3 -4 -5arrow_forward
- 1. We want to graph the function f(x) log4 x. In a table below, = find at three points with nice integer y-values (no rounding!) and then graph the function at right. Be sure to clearly indicate any asymptotes. (4 points) 3 2 1- -1 0 1 2 3 4 5 10 X log4(x) -1 -2 -3- 6 7 8 00arrow_forwardGraph y=log2(x+3) 10+ 9 8 7- 6 5 4 3 3 2 1 10 -9 -8 -7 -6 -5 -4 -3-2-1 1 2 3 4 5 6 7 8 7 8 9 10 -1 -2 -3 -4 -5 -6 -7- -8 -9 -10 Clear All Drawarrow_forwardWrite an equation for the graph below. +10+ 9 10 -9 -8 -7 -6 -5 -4 -3-2-1 8 7 6 5 4 3 2 1 1 3 4 5 6 7 8 9 10 -1 -2 -3 -4 -5 -6 -7 -8 f(x) = 9 -9 -10-arrow_forward
 Algebra & Trigonometry with Analytic GeometryAlgebraISBN:9781133382119Author:SwokowskiPublisher:Cengage