
ELEMENTARY SATISTICS IA
13th Edition
ISBN: 9780137695522
Author: Triola
Publisher: PEARSON C
expand_more
expand_more
format_list_bulleted
Concept explainers
Videos
Textbook Question
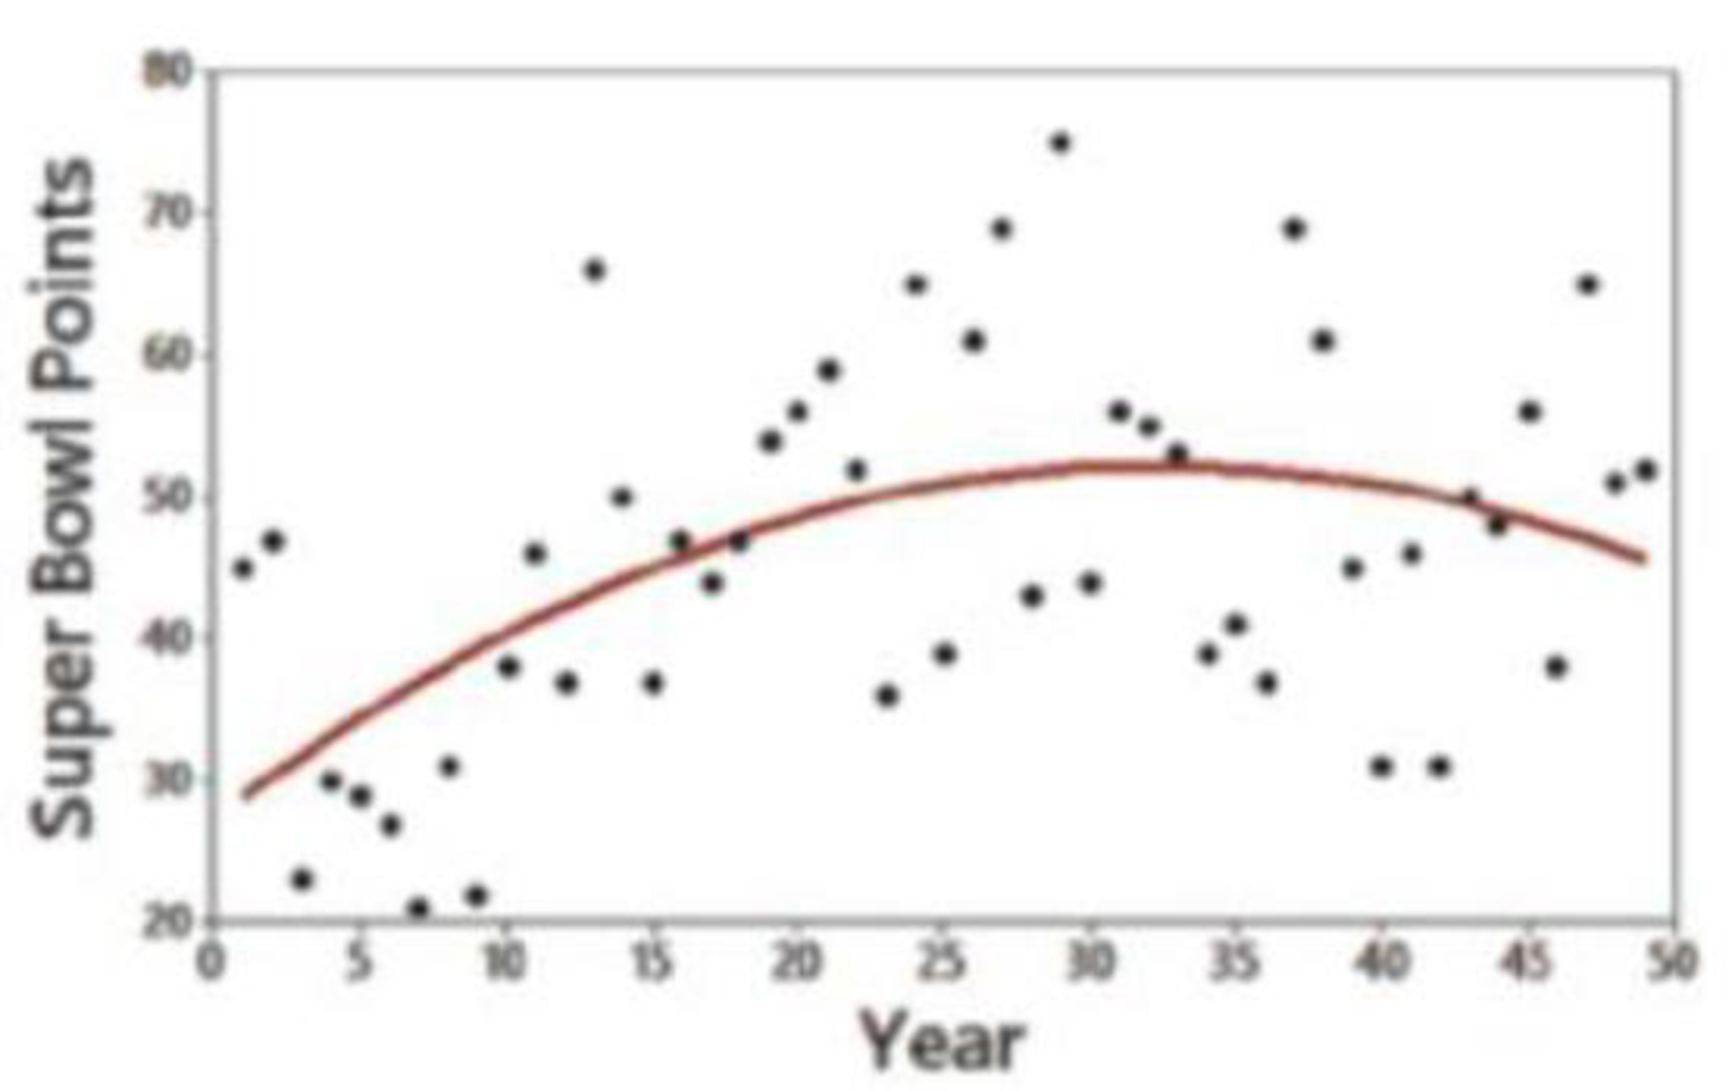
Chapter 10.5, Problem 4BSC
Interpreting a Graph The accompanying graph plots the numbers of points scored in each Super Bowl to the last Super Bowl at the time of this writing. The graph of the
Expert Solution & Answer
Want to see the full answer?
Check out a sample textbook solution
Students have asked these similar questions
a small pond contains eight catfish and six bluegill. If seven fish are caught at random, what is the probability that exactly five catfish have been caught?
23 The line graph in the following figure shows
Revenue ($ millions)
one company's revenues over time. Explain
why this graph is misleading and what you
can do to fix the problem.
700
60-
50-
40
30
Line Graph of Revenue
20-
101
1950
1970
1975 1980 1985
Year
1990
2000
d of the
20
respectively.
Interpret the shape, center and spread of the
following box plot.
14
13
12
11
10
6
T
89
7
9
5.
治
Chapter 10 Solutions
ELEMENTARY SATISTICS IA
Ch. 10.1 - Notation Twenty different statistics students are...Ch. 10.1 - Interpreting r For the some two variables...Ch. 10.1 - Global Warming If we find that there is a linear...Ch. 10.1 - Scatterplots Match these values of r with the five...Ch. 10.1 - Bear Weight and Chest Size Fifty-four wild bears...Ch. 10.1 - Casino Size and Revenue The New York Times...Ch. 10.1 - Garbage Data Set 31 Garbage Weight in Appendix B...Ch. 10.1 - Cereal Killers The amounts of sugar (grams of...Ch. 10.1 - Explore! Exercises 9 and 10 provide two data sets...Ch. 10.1 - Explore! Exercises 9 and 10 provide two data sets...
Ch. 10.1 - Outlier Refer to the accompanying...Ch. 10.1 - Clusters Refer to the following Minitab-generated...Ch. 10.1 - Testing for a Linear Correlation. In Exercises...Ch. 10.1 - Testing for a Linear Correlation. In Exercises...Ch. 10.1 - Testing for a Linear Correlation. In Exercises...Ch. 10.1 - Testing for a Linear Correlation. In Exercises...Ch. 10.1 - Testing for a Linear Correlation. In Exercises...Ch. 10.1 - Testing for a Linear Correlation. In Exercises...Ch. 10.1 - Testing for a Linear Correlation. In Exercises...Ch. 10.1 - Testing for a Linear Correlation. In Exercises...Ch. 10.1 - Testing for a Linear Correlation. In Exercises...Ch. 10.1 - Testing for a Linear Correlation. In Exercises...Ch. 10.1 - Testing for a Linear Correlation. In Exercises...Ch. 10.1 - Testing for a Linear Correlation. In Exercises...Ch. 10.1 - Testing for a Linear Correlation. In Exercises...Ch. 10.1 - Testing for a Linear Correlation. In Exercises...Ch. 10.1 - Testing for a Linear Correlation. In Exercises...Ch. 10.1 - Testing for a Linear Correlation. In Exercises...Ch. 10.1 - Appendix B Data Sets. In Exercises 2934, use the...Ch. 10.1 - Appendix B Data Sets. In Exercises 2934, use the...Ch. 10.1 - Appendix B Data Sets. In Exercises 2934, use the...Ch. 10.1 - Appendix B Data Sets. In Exercises 2934, use the...Ch. 10.1 - Appendix B Data Sets. In Exercises 2934, use the...Ch. 10.1 - Appendix B Data Sets. In Exercises 2934, use the...Ch. 10.1 - Transformed Data In addition to testing for a...Ch. 10.1 - Finding Critical r Values Table A-6 lists critical...Ch. 10.2 - Notation Different hotels on Las Vegas Boulevard...Ch. 10.2 - Notation What is the difference between the...Ch. 10.2 - Best-Fit Line a. What is a residual? b. In what...Ch. 10.2 - Correlation and Slope What is the relationship...Ch. 10.2 - Making Predictions. In Exercises 58, let the...Ch. 10.2 - Making Predictions. In Exercises 58, let the...Ch. 10.2 - Making Predictions. In Exercises 58, let the...Ch. 10.2 - Making Predictions. In Exercises 58, let the...Ch. 10.2 - Finding the Equation of the Regression Line. In...Ch. 10.2 - Finding the Equation of the Regression Line. In...Ch. 10.2 - Effects of an Outlier Refer to the Mini...Ch. 10.2 - Effects of Clusters Refer to the Minitab-generated...Ch. 10.2 - Regression and Predictions. Exercises 1328 use the...Ch. 10.2 - Regression and Predictions. Exercises 1328 use the...Ch. 10.2 - Regression and Predictions. Exercises 1328 use the...Ch. 10.2 - Regression and Predictions. Exercises 1328 use the...Ch. 10.2 - Regression and Predictions. Exercises 1328 use the...Ch. 10.2 - Regression and Predictions. Exercises 1328 use the...Ch. 10.2 - Regression and Predictions. Exercises 1328 use the...Ch. 10.2 - Regression and Predictions. Exercises 1328 use the...Ch. 10.2 - Regression and Predictions. Exercises 1328 use the...Ch. 10.2 - Regression and Predictions. Exercises 1328 use the...Ch. 10.2 - Regression and Predictions. Exercises 1328 use the...Ch. 10.2 - Regression and Predictions. Exercises 1328 use the...Ch. 10.2 - Regression and Predictions. Exercises 13-28 use...Ch. 10.2 - Regression and Predictions. Exercises 13-28 use...Ch. 10.2 - Regression and Predictions. Exercises 13-28 use...Ch. 10.2 - Regression and Predictions. Exercises 13-28 use...Ch. 10.2 - Large Data Sets. Exercises 29-32 use the same...Ch. 10.2 - Large Data Sets. Exercises 29-32 use the same...Ch. 10.2 - Large Data Sets. Exercises 29-32 use the same...Ch. 10.2 - Large Data Sets. Exercises 29-32 use the same...Ch. 10.2 - Word Counts of Men and Women Refer to Data Set 24...Ch. 10.2 - Earthquakes Refer lo Data Set 21 Earthquakes in...Ch. 10.2 - Least-Squares Property According to the...Ch. 10.3 - se Notation Using Data Set 1 Body Data in Appendix...Ch. 10.3 - Prediction Interval Using the heights and weights...Ch. 10.3 - Coefficient of Determination Using the heights and...Ch. 10.3 - Standard Error of Estimate A random sample of 118...Ch. 10.3 - Interpreting the Coefficient of Determination. In...Ch. 10.3 - Interpreting the Coefficient of Determination. In...Ch. 10.3 - Interpreting the Coefficient of Determination. In...Ch. 10.3 - Interpreting the Coefficient of Determination. In...Ch. 10.3 - Interpreting a Computer Display. In Exercises...Ch. 10.3 - Interpreting a Computer Display. In Exercises...Ch. 10.3 - Interpreting a Computer Display. In Exercises...Ch. 10.3 - Interpreting a Computer Display. In Exercises...Ch. 10.3 - Finding a Prediction Interval. In Exercises 13-16,...Ch. 10.3 - Finding a Prediction Interval. In Exercises 13-16,...Ch. 10.3 - Finding a Prediction Interval. In Exercises 13-16,...Ch. 10.3 - Finding a Prediction Interval. In Exercises 13-16,...Ch. 10.3 - Variation and Prediction Intervals. In Exercises...Ch. 10.3 - Variation and Prediction Intervals. In Exercises...Ch. 10.3 - Variation and Prediction Intervals. In Exercises...Ch. 10.3 - Variation and Prediction Intervals. In Exercises...Ch. 10.3 - Confidence Interval for Mean Predicted Value...Ch. 10.4 - Terminology Using the lengths (in.). chest sizes...Ch. 10.4 - Best Multiple Regression Equation For the...Ch. 10.4 - Adjusted Coefficient of Determination For Exercise...Ch. 10.4 - Interpreting R2 For the multiple regression...Ch. 10.4 - Interpreting a Computer Display. In Exercises 5-8,...Ch. 10.4 - Interpreting a Computer Display. In Exercises 5-8,...Ch. 10.4 - Interpreting a Computer Display. In Exercises 5-8,...Ch. 10.4 - Interpreting a Computer Display. In Exercises 5-8,...Ch. 10.4 - City Fuel Consumption: Finding the Best Multiple...Ch. 10.4 - City Fuel Consumption: Finding the Best Multiple...Ch. 10.4 - City Fuel Consumption: Finding the Best Multiple...Ch. 10.4 - City Fuel Consumption: Finding the Best Multiple...Ch. 10.4 - Appendix B Data Sets. In Exercises 13-16, refer to...Ch. 10.4 - Prob. 14BSCCh. 10.4 - Appendix B Data Sets. In Exercises 13-16, refer to...Ch. 10.4 - Appendix B Data Sets. In Exercises 13-16, refer to...Ch. 10.4 - Testing Hypotheses About Regression Coefficients...Ch. 10.4 - Confidence Intervals for a Regression Coefficients...Ch. 10.4 - Dummy Variable Refer to Data Set 9 Bear...Ch. 10.5 - Identifying a Model and R2 Different samples are...Ch. 10.5 - Super Bowl and R2 Let x represent years coded as...Ch. 10.5 - Super Bowl and R2 Let x represent years coded as...Ch. 10.5 - Interpreting a Graph The accompanying graph plots...Ch. 10.5 - Finding the Best Model. In Exercises 5-16,...Ch. 10.5 - Finding the Best Model. In Exercises 5-16,...Ch. 10.5 - Finding the Best Model. In Exercises 5-16,...Ch. 10.5 - Finding the Best Model. In Exercises 5-16,...Ch. 10.5 - Finding the Best Model. In Exercises 5-16,...Ch. 10.5 - Finding the Best Model. In Exercises 5-16,...Ch. 10.5 - Finding the Best Model. In Exercises 5-16,...Ch. 10.5 - Finding the Best Model. In Exercises 5-16,...Ch. 10.5 - Finding the Best Model. In Exercises 5-16,...Ch. 10.5 - Finding the Best Model. In Exercises 5-16,...Ch. 10.5 - Finding the Best Model. In Exercises 5-16,...Ch. 10.5 - Finding the Best Model. In Exercises 5-16,...Ch. 10.5 - Sum of Squares Criterion In addition to the value...Ch. 10 - The following exercises are based on the following...Ch. 10 - The following exercises are based on the following...Ch. 10 - The following exercises are based on the following...Ch. 10 - The following exercises are based on the following...Ch. 10 - The following exercises are based on the following...Ch. 10 - The following exercises are based on the following...Ch. 10 - The following exercises are based on the following...Ch. 10 - The following exercises are based on the following...Ch. 10 - The following exercises are based on the following...Ch. 10 - Interpreting Scatterplot If the sample data were...Ch. 10 - Cigarette Tar and Nicotine The table below lists...Ch. 10 - 2. Cigarette Nicotine and Carbon Monoxide Refer to...Ch. 10 - Time and Motion In a physics experiment at Doane...Ch. 10 - 4. Multiple Regression with Cigarettes Use the...Ch. 10 - Stocks and Sunspots. Listed below are annual high...Ch. 10 - Stocks and Sunspots. Listed below are annual high...Ch. 10 - Stocks and Sunspots. Listed below are annual high...Ch. 10 - Stocks and Sunspots. Listed below are annual high...Ch. 10 - Stocks and Sunspots. Listed below are annual high...Ch. 10 - Cell Phones and Driving In the authors home town...Ch. 10 - Ages of Moviegoers The table below shows the...Ch. 10 - Ages of Moviegoers Based on the data from...Ch. 10 - Speed Dating Data Set 18 Speed Dating" in Appendix...Ch. 10 - Speed Dating Data Set 18 Speed Dating" in Appendix...Ch. 10 - Speed Dating Data Set 18 Speed Dating" in Appendix...Ch. 10 - Speed Dating Data Set 18 Speed Dating" in Appendix...Ch. 10 - Speed Dating Data Set 18 Speed Dating in Appendix...Ch. 10 - Speed Dating Data Set 18 Speed Dating in Appendix...Ch. 10 - Critical Thinking: Is the pain medicine Duragesic...Ch. 10 - Critical Thinking: Is the pain medicine Duragesic...Ch. 10 - Critical Thinking: Is the pain medicine Duragesic...Ch. 10 - Critical Thinking: Is the pain medicine Duragesic...Ch. 10 - Critical Thinking: Is the pain medicine Duragesic...
Knowledge Booster


Learn more about
Need a deep-dive on the concept behind this application? Look no further. Learn more about this topic, statistics and related others by exploring similar questions and additional content below.Similar questions
- F Make a box plot from the five-number summary: 100, 105, 120, 135, 140. harrow_forward14 Is the standard deviation affected by skewed data? If so, how? foldarrow_forwardFrequency 15 Suppose that your friend believes his gambling partner plays with a loaded die (not fair). He shows you a graph of the outcomes of the games played with this die (see the following figure). Based on this graph, do you agree with this person? Why or why not? 65 Single Die Outcomes: Graph 1 60 55 50 45 40 1 2 3 4 Outcome 55 6arrow_forward
- lie y H 16 The first month's telephone bills for new customers of a certain phone company are shown in the following figure. The histogram showing the bills is misleading, however. Explain why, and suggest a solution. Frequency 140 120 100 80 60 40 20 0 0 20 40 60 80 Telephone Bill ($) 100 120arrow_forward25 ptical rule applies because t Does the empirical rule apply to the data set shown in the following figure? Explain. 2 6 5 Frequency 3 сл 2 1 0 2 4 6 8 00arrow_forward24 Line graphs typically connect the dots that represent the data values over time. If the time increments between the dots are large, explain why the line graph can be somewhat misleading.arrow_forward
- 17 Make a box plot from the five-number summary: 3, 4, 7, 16, 17. 992) waarrow_forward12 10 - 8 6 4 29 0 Interpret the shape, center and spread of the following box plot. brill smo slob.nl bagharrow_forwardSuppose that a driver's test has a mean score of 7 (out of 10 points) and standard deviation 0.5. a. Explain why you can reasonably assume that the data set of the test scores is mound-shaped. b. For the drivers taking this particular test, where should 68 percent of them score? c. Where should 95 percent of them score? d. Where should 99.7 percent of them score? Sarrow_forward
- 13 Can the mean of a data set be higher than most of the values in the set? If so, how? Can the median of a set be higher than most of the values? If so, how? srit to estaarrow_forwardA random variable X takes values 0 and 1 with probabilities q and p, respectively, with q+p=1. find the moment generating function of X and show that all the moments about the origin equal p. (Note- Please include as much detailed solution/steps in the solution to understand, Thank you!)arrow_forward1 (Expected Shortfall) Suppose the price of an asset Pt follows a normal random walk, i.e., Pt = Po+r₁ + ... + rt with r₁, r2,... being IID N(μ, o²). Po+r1+. ⚫ Suppose the VaR of rt is VaRq(rt) at level q, find the VaR of the price in T days, i.e., VaRq(Pt – Pt–T). - • If ESq(rt) = A, find ES₁(Pt – Pt–T).arrow_forward
arrow_back_ios
SEE MORE QUESTIONS
arrow_forward_ios
Recommended textbooks for you
 Glencoe Algebra 1, Student Edition, 9780079039897...AlgebraISBN:9780079039897Author:CarterPublisher:McGraw Hill
 Big Ideas Math A Bridge To Success Algebra 1: Stu...AlgebraISBN:9781680331141Author:HOUGHTON MIFFLIN HARCOURTPublisher:Houghton Mifflin Harcourt
 Holt Mcdougal Larson Pre-algebra: Student Edition...AlgebraISBN:9780547587776Author:HOLT MCDOUGALPublisher:HOLT MCDOUGAL
 Algebra: Structure And Method, Book 1AlgebraISBN:9780395977224Author:Richard G. Brown, Mary P. Dolciani, Robert H. Sorgenfrey, William L. ColePublisher:McDougal Littell
 College Algebra (MindTap Course List)AlgebraISBN:9781305652231Author:R. David Gustafson, Jeff HughesPublisher:Cengage Learning
Glencoe Algebra 1, Student Edition, 9780079039897...
Algebra
ISBN:9780079039897
Author:Carter
Publisher:McGraw Hill
Big Ideas Math A Bridge To Success Algebra 1: Stu...
Algebra
ISBN:9781680331141
Author:HOUGHTON MIFFLIN HARCOURT
Publisher:Houghton Mifflin Harcourt
Holt Mcdougal Larson Pre-algebra: Student Edition...
Algebra
ISBN:9780547587776
Author:HOLT MCDOUGAL
Publisher:HOLT MCDOUGAL
Algebra: Structure And Method, Book 1
Algebra
ISBN:9780395977224
Author:Richard G. Brown, Mary P. Dolciani, Robert H. Sorgenfrey, William L. Cole
Publisher:McDougal Littell
College Algebra (MindTap Course List)
Algebra
ISBN:9781305652231
Author:R. David Gustafson, Jeff Hughes
Publisher:Cengage Learning
The Shape of Data: Distributions: Crash Course Statistics #7; Author: CrashCourse;https://www.youtube.com/watch?v=bPFNxD3Yg6U;License: Standard YouTube License, CC-BY
Shape, Center, and Spread - Module 20.2 (Part 1); Author: Mrmathblog;https://www.youtube.com/watch?v=COaid7O_Gag;License: Standard YouTube License, CC-BY
Shape, Center and Spread; Author: Emily Murdock;https://www.youtube.com/watch?v=_YyW0DSCzpM;License: Standard Youtube License