
Mathematical Statistics with Applications
7th Edition
ISBN: 9780495110811
Author: Dennis Wackerly, William Mendenhall, Richard L. Scheaffer
Publisher: Cengage Learning
expand_more
expand_more
format_list_bulleted
Videos
Textbook Question
Chapter 10.5, Problem 45E
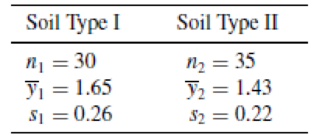
Refer to Exercise 10.21. Construct a 99% confidence interval for the difference in mean shear strengths for the two soil types.
- a Is the value μ1 − μ2 = 0 inside or outside this interval?
- b Based on the interval, should the null hypothesis discussed in Exercise 10.21 be rejected? Why?
- c How does the conclusion that you reached compare with your conclusion in Exercise 10.21?
10.21 Shear strength measurements derived from unconfined compression tests for two types of soils gave the results shown in the following table (measurements in tons per square foot). Do the soils appear to differ with respect to average shear strength, at the 1% significance level?
Expert Solution & Answer

Trending nowThis is a popular solution!

Students have asked these similar questions
In a company with 80 employees, 60 earn $10.00 per hour and 20 earn $13.00 per
hour.
Is this average hourly wage considered representative?
The following is a list of questions answered correctly on an exam. Calculate the
Measures of Central Tendency from the ungrouped data list.
NUMBER OF QUESTIONS ANSWERED CORRECTLY ON AN APTITUDE EXAM
112
72
69
97
107
73
92
76
86
73
126
128
118
127
124
82
104
132
134
83
92
108
96
100
92
115
76
91
102
81
95
141
81
80
106
84
119
113
98
75
68
98
115
106
95
100
85
94
106
119
The following ordered data list shows the data speeds for cell phones used by a
telephone company at an airport:
A. Calculate the Measures of Central Tendency using the table in point B.
B. Are there differences in the measurements obtained in A and C? Why (give at
least one justified reason)?
0.8
1.4
1.8
1.9
3.2
3.6
4.5
4.5
4.6
6.2
6.5
7.7
7.9
9.9
10.2
10.3
10.9
11.1
11.1
11.6
11.8
12.0
13.1
13.5
13.7
14.1
14.2
14.7
15.0
15.1
15.5
15.8
16.0
17.5
18.2
20.2
21.1
21.5
22.2
22.4
23.1
24.5
25.7
28.5
34.6
38.5
43.0
55.6
71.3
77.8
Chapter 10 Solutions
Mathematical Statistics with Applications
Ch. 10.2 - Define and for a statistical test of hypotheses.Ch. 10.2 - An experimenter has prepared a drug dosage level...Ch. 10.2 - Refer to Exercise 10.2. a Find the rejection...Ch. 10.2 - Suppose that we wish to test the null hypothesis...Ch. 10.2 - Let Y1 and Y2 be independent and identically...Ch. 10.2 - We are interested in testing whether or not a coin...Ch. 10.2 - True or False Refer to Exercise 10.6. a The level...Ch. 10.2 - A two-stage clinical trial is planned for testing...Ch. 10.3 - A survey published in the American Journal of...Ch. 10.3 - The hourly wages in a particular industry are...
Ch. 10.3 - The output voltage for an electric circuit is...Ch. 10.3 - The Rockwell hardness index for steel is...Ch. 10.3 - Shear strength measurements derived from...Ch. 10.3 - Prob. 22ECh. 10.3 - Studies of the habits of white-tailed deer...Ch. 10.3 - A study by Childrens Hospital in Boston indicates...Ch. 10.3 - An article in American Demographics reports that...Ch. 10.3 - According to the Washington Post, nearly 45% of...Ch. 10.3 - The state of California is working very hard to...Ch. 10.3 - Prob. 28ECh. 10.3 - Prob. 29ECh. 10.3 - Prob. 30ECh. 10.3 - Prob. 31ECh. 10.3 - In March 2001, a Gallup poll asked. How would you...Ch. 10.3 - A political researcher believes that the fraction...Ch. 10.3 - Exercise 8.58 stated that a random sample of 500...Ch. 10.3 - Michael Sosin investigated determinants that...Ch. 10.3 - Prob. 36ECh. 10.4 - Refer to Exercise 10.19. If the voltage falls as...Ch. 10.4 - Refer to Exercise 10.20. The steel is sufficiently...Ch. 10.4 - Refer to Exercise 10.30. Calculate the value of ...Ch. 10.4 - Refer to Exercise 10.33. The political researcher...Ch. 10.4 - Refer to Exercise 10.34. Using the rejection...Ch. 10.4 - In Exercises 10.34 and 10.41, how large should the...Ch. 10.4 - A random sample of 37 second graders who...Ch. 10.4 - Refer to Exercise 10.43. Find the sample sizes...Ch. 10.5 - Refer to Exercise 10.21. Construct a 99%...Ch. 10.5 - Prob. 46ECh. 10.5 - Prob. 47ECh. 10.5 - Prob. 48ECh. 10.5 - Prob. 49ECh. 10.6 - High airline occupancy rates on scheduled flights...Ch. 10.6 - Two sets of elementary schoolchildren were taught...Ch. 10.6 - A biologist has hypothesized that high...Ch. 10.6 - How would you like to live to be 200 years old?...Ch. 10.6 - Do you believe that an exceptionally high...Ch. 10.6 - A check-cashing service found that approximately...Ch. 10.6 - Prob. 56ECh. 10.6 - Prob. 57ECh. 10.6 - Prob. 58ECh. 10.8 - Why is the Z test usually inappropriate as a test...Ch. 10.8 - Prob. 62ECh. 10.8 - A chemical process has produced, on the average,...Ch. 10.8 - A coin-operated soft-drink machine was designed to...Ch. 10.8 - Operators of gasoline-fueled vehicles complain...Ch. 10.8 - Researchers have shown that cigarette smoking has...Ch. 10.8 - Nutritional information provided by Kentucky Fried...Ch. 10.8 - Prob. 68ECh. 10.8 - Two methods for teaching reading were applied to...Ch. 10.8 - A study was conducted by the Florida Game and Fish...Ch. 10.8 - Under normal conditions, is the average body...Ch. 10.8 - Prob. 72ECh. 10.8 - In Exercise 8.83, we presented some data collected...Ch. 10.8 - Prob. 74ECh. 10.8 - Prob. 75ECh. 10.8 - Prob. 76ECh. 10.8 - Prob. 77ECh. 10.9 - A manufacturer of hard safety hats for...Ch. 10.9 - Prob. 79ECh. 10.9 - Prob. 80ECh. 10.9 - Prob. 81ECh. 10.9 - Exercises 8.83 and 10.73 presented some data...Ch. 10.9 - Prob. 83ECh. 10.9 - An experiment published in The American Biology...Ch. 10.9 - Prob. 85ECh. 10.9 - Aptitude tests should produce scores with a large...Ch. 10.9 - Prob. 87ECh. 10.10 - Refer to Exercise 10.2. Find the power of the test...Ch. 10.10 - Prob. 89ECh. 10.10 - Refer to Exercise 10.5. a Find the power of test 2...Ch. 10.10 - Let Y1, Y2,, Y20 be a random sample of size n = 20...Ch. 10.10 - Consider the situation described in Exercise...Ch. 10.10 - For a normal distribution with mean and variance...Ch. 10.10 - Suppose that Y1, Y2, ,Yn constitute a random...Ch. 10.10 - Prob. 95ECh. 10.10 - Prob. 96ECh. 10.10 - Prob. 97ECh. 10.10 - Prob. 98ECh. 10.10 - Prob. 99ECh. 10.10 - Prob. 100ECh. 10.10 - Prob. 101ECh. 10.10 - Prob. 102ECh. 10.10 - Prob. 103ECh. 10.10 - Refer to the random sample of Exercise 10.103. a...Ch. 10.11 - Let Y1, Y2,, Yn denote a random sample from a...Ch. 10.11 - A survey of voter sentiment was conducted in four...Ch. 10.11 - Prob. 107ECh. 10.11 - Prob. 108ECh. 10.11 - Let X1, X2,, Xm denote a random sample from the...Ch. 10.11 - Show that a likelihood ratio test depends on the...Ch. 10.11 - Suppose that we are interested in testing the...Ch. 10.11 - Prob. 112ECh. 10.11 - Refer to Exercise 10.112. Show that in testing of...Ch. 10.11 - Prob. 114ECh. 10 - True or False. a If the p-value for a test is...Ch. 10 - Prob. 116SECh. 10 - Prob. 117SECh. 10 - Prob. 118SECh. 10 - Prob. 119SECh. 10 - Prob. 120SECh. 10 - Prob. 121SECh. 10 - Prob. 122SECh. 10 - A pharmaceutical manufacturer purchases a...Ch. 10 - Prob. 124SECh. 10 - Prob. 125SECh. 10 - Prob. 126SECh. 10 - Prob. 127SECh. 10 - Prob. 128SECh. 10 - Prob. 129SECh. 10 - Prob. 130SE
Knowledge Booster


Learn more about
Need a deep-dive on the concept behind this application? Look no further. Learn more about this topic, statistics and related others by exploring similar questions and additional content below.Similar questions
- In a company with 80 employees, 60 earn $10.00 per hour and 20 earn $13.00 per hour. a) Determine the average hourly wage. b) In part a), is the same answer obtained if the 60 employees have an average wage of $10.00 per hour? Prove your answer.arrow_forwardThe following ordered data list shows the data speeds for cell phones used by a telephone company at an airport: A. Calculate the Measures of Central Tendency from the ungrouped data list. B. Group the data in an appropriate frequency table. 0.8 1.4 1.8 1.9 3.2 3.6 4.5 4.5 4.6 6.2 6.5 7.7 7.9 9.9 10.2 10.3 10.9 11.1 11.1 11.6 11.8 12.0 13.1 13.5 13.7 14.1 14.2 14.7 15.0 15.1 15.5 15.8 16.0 17.5 18.2 20.2 21.1 21.5 22.2 22.4 23.1 24.5 25.7 28.5 34.6 38.5 43.0 55.6 71.3 77.8arrow_forwardBusinessarrow_forward
- https://www.hawkeslearning.com/Statistics/dbs2/datasets.htmlarrow_forwardNC Current Students - North Ce X | NC Canvas Login Links - North ( X Final Exam Comprehensive x Cengage Learning x WASTAT - Final Exam - STAT → C webassign.net/web/Student/Assignment-Responses/submit?dep=36055360&tags=autosave#question3659890_9 Part (b) Draw a scatter plot of the ordered pairs. N Life Expectancy Life Expectancy 80 70 600 50 40 30 20 10 Year of 1950 1970 1990 2010 Birth O Life Expectancy Part (c) 800 70 60 50 40 30 20 10 1950 1970 1990 W ALT 林 $ # 4 R J7 Year of 2010 Birth F6 4+ 80 70 60 50 40 30 20 10 Year of 1950 1970 1990 2010 Birth Life Expectancy Ox 800 70 60 50 40 30 20 10 Year of 1950 1970 1990 2010 Birth hp P.B. KA & 7 80 % 5 H A B F10 711 N M K 744 PRT SC ALT CTRLarrow_forwardHarvard University California Institute of Technology Massachusetts Institute of Technology Stanford University Princeton University University of Cambridge University of Oxford University of California, Berkeley Imperial College London Yale University University of California, Los Angeles University of Chicago Johns Hopkins University Cornell University ETH Zurich University of Michigan University of Toronto Columbia University University of Pennsylvania Carnegie Mellon University University of Hong Kong University College London University of Washington Duke University Northwestern University University of Tokyo Georgia Institute of Technology Pohang University of Science and Technology University of California, Santa Barbara University of British Columbia University of North Carolina at Chapel Hill University of California, San Diego University of Illinois at Urbana-Champaign National University of Singapore McGill…arrow_forward
- Name Harvard University California Institute of Technology Massachusetts Institute of Technology Stanford University Princeton University University of Cambridge University of Oxford University of California, Berkeley Imperial College London Yale University University of California, Los Angeles University of Chicago Johns Hopkins University Cornell University ETH Zurich University of Michigan University of Toronto Columbia University University of Pennsylvania Carnegie Mellon University University of Hong Kong University College London University of Washington Duke University Northwestern University University of Tokyo Georgia Institute of Technology Pohang University of Science and Technology University of California, Santa Barbara University of British Columbia University of North Carolina at Chapel Hill University of California, San Diego University of Illinois at Urbana-Champaign National University of Singapore…arrow_forwardA company found that the daily sales revenue of its flagship product follows a normal distribution with a mean of $4500 and a standard deviation of $450. The company defines a "high-sales day" that is, any day with sales exceeding $4800. please provide a step by step on how to get the answers in excel Q: What percentage of days can the company expect to have "high-sales days" or sales greater than $4800? Q: What is the sales revenue threshold for the bottom 10% of days? (please note that 10% refers to the probability/area under bell curve towards the lower tail of bell curve) Provide answers in the yellow cellsarrow_forwardFind the critical value for a left-tailed test using the F distribution with a 0.025, degrees of freedom in the numerator=12, and degrees of freedom in the denominator = 50. A portion of the table of critical values of the F-distribution is provided. Click the icon to view the partial table of critical values of the F-distribution. What is the critical value? (Round to two decimal places as needed.)arrow_forward
- A retail store manager claims that the average daily sales of the store are $1,500. You aim to test whether the actual average daily sales differ significantly from this claimed value. You can provide your answer by inserting a text box and the answer must include: Null hypothesis, Alternative hypothesis, Show answer (output table/summary table), and Conclusion based on the P value. Showing the calculation is a must. If calculation is missing,so please provide a step by step on the answers Numerical answers in the yellow cellsarrow_forwardShow all workarrow_forwardShow all workarrow_forward
arrow_back_ios
SEE MORE QUESTIONS
arrow_forward_ios
Recommended textbooks for you
 MATLAB: An Introduction with ApplicationsStatisticsISBN:9781119256830Author:Amos GilatPublisher:John Wiley & Sons Inc
 Probability and Statistics for Engineering and th...StatisticsISBN:9781305251809Author:Jay L. DevorePublisher:Cengage Learning
 Statistics for The Behavioral Sciences (MindTap C...StatisticsISBN:9781305504912Author:Frederick J Gravetter, Larry B. WallnauPublisher:Cengage Learning
 Elementary Statistics: Picturing the World (7th E...StatisticsISBN:9780134683416Author:Ron Larson, Betsy FarberPublisher:PEARSON
 The Basic Practice of StatisticsStatisticsISBN:9781319042578Author:David S. Moore, William I. Notz, Michael A. FlignerPublisher:W. H. Freeman
 Introduction to the Practice of StatisticsStatisticsISBN:9781319013387Author:David S. Moore, George P. McCabe, Bruce A. CraigPublisher:W. H. Freeman
MATLAB: An Introduction with Applications
Statistics
ISBN:9781119256830
Author:Amos Gilat
Publisher:John Wiley & Sons Inc
Probability and Statistics for Engineering and th...
Statistics
ISBN:9781305251809
Author:Jay L. Devore
Publisher:Cengage Learning
Statistics for The Behavioral Sciences (MindTap C...
Statistics
ISBN:9781305504912
Author:Frederick J Gravetter, Larry B. Wallnau
Publisher:Cengage Learning
Elementary Statistics: Picturing the World (7th E...
Statistics
ISBN:9780134683416
Author:Ron Larson, Betsy Farber
Publisher:PEARSON
The Basic Practice of Statistics
Statistics
ISBN:9781319042578
Author:David S. Moore, William I. Notz, Michael A. Fligner
Publisher:W. H. Freeman
Introduction to the Practice of Statistics
Statistics
ISBN:9781319013387
Author:David S. Moore, George P. McCabe, Bruce A. Craig
Publisher:W. H. Freeman
Hypothesis Testing using Confidence Interval Approach; Author: BUM2413 Applied Statistics UMP;https://www.youtube.com/watch?v=Hq1l3e9pLyY;License: Standard YouTube License, CC-BY
Hypothesis Testing - Difference of Two Means - Student's -Distribution & Normal Distribution; Author: The Organic Chemistry Tutor;https://www.youtube.com/watch?v=UcZwyzwWU7o;License: Standard Youtube License