To state: A sinusoidal model using a graphing calculator that gives D as a function t . The time t is measured in months, with
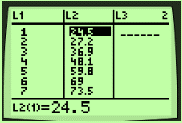
| t | 1 | 2 | 3 | 4 | 5 | 6 | 7 | 8 | 9 | 10 | 11 | 12 |
| D | 24.5 | 27.2 | 36.9 | 48.1 | 59.8 | 69 | 73.5 | 71.8 | 63.9 | 51.9 | 40.7 | 29.6 |
The resultant answer is
Given information:
The given table is shown below:
| t | 1 | 2 | 3 | 4 | 5 | 6 | 7 | 8 | 9 | 10 | 11 | 12 |
| D | 24.5 | 27.2 | 36.9 | 48.1 | 59.8 | 69 | 73.5 | 71.8 | 63.9 | 51.9 | 40.7 | 29.6 |
Explanation:
Consider the given table:
| t | 1 | 2 | 3 | 4 | 5 | 6 | 7 | 8 | 9 | 10 | 11 | 12 |
| D | 24.5 | 27.2 | 36.9 | 48.1 | 59.8 | 69 | 73.5 | 71.8 | 63.9 | 51.9 | 40.7 | 29.6 |
First enter the data in a graphing calculator:
Make a
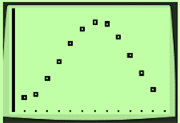
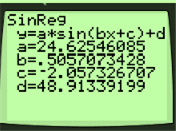
Now perform a sinusoidal regression, because the scatter plot appears sinusoidal:
Graph the model and the data in the same viewing window:
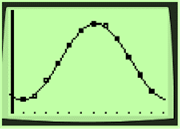
The model appears to be a good fit. So, a model for the data is:
Chapter 10 Solutions
Mcdougal Littell Algebra 2: Student Edition (c) 2004 2004

- Describe the y-intercept and end behavior of the following graph: 0 2 4 -2 -4 -6arrow_forwardComputing Ending Inventory under Dollar-Value LIFO Wheels Inc. accounts for inventory using the dollar-value LIFO method. The following information is available for Year 1 through Year 3 (listed chronologically). Year Ending Inventory at FIFO Price Index Year 1 Year 2 Year 3 $6,000 1.00 9,600 1.10 12,000 1.13 Compute ending inventory under the dollar-value LIFO method for Year 1, Year 2, and Year 3. • Note: Round your answers to the nearest whole dollar.arrow_forwardUpland Co.'s inventory records showed the following data accounted for in a perpetual inventory system. Unit Date June 1 Units Cost Inventory (beg.) 700 $8.00 June 3 Purchases 1,400 8.40 June 7 Sales (at $16 per unit) 980 952 9.00 June 20 Purchases June 22 Sales (at $16 per unit) 1,540 What is (a) ending inventory on June 30, and (b) cost of goods sold for June, using the FIFO inventory method? •Note: Do not use negative signs with any of your answers. •Note: List the inventory units in chronological order based on their purchase date with beginning inventory, if any, listed first.arrow_forward
- Explain how solve 4x + 3 = 7 using the change of base formula logy: logy. Include the solution for x in your answer. Round your answer to the nearest thousandth. log barrow_forward5. Consider the following vectors 0.1 3.2 -0-0-0 = 5.4 6.0 = z= 3 0.1 For each of exercises a-e, either compute the desired quantity by hand with work shown or explain why the desired quantity is not defined. (a) 10x (b) 10-27 (c) J+Z (d) (x, y) (e) (x, z)arrow_forwardConsider the graph/network plotted below. 1 6 5 3 Explicitly give (i.e., write down all of the entries) the adjacency matrix A of the graph.arrow_forward
- . Given the function f: XY (with X and Y as above) defined as f(2) = 2, f(4) = 1, ƒ(6)=3, ƒ(8) = 2, answer the following questions. Justify your answers. (a) [4 points] Is f injective? (b) [4 points] Is f surjective? (c) [2 points] Is f bijective?arrow_forward1. Let 15 -14 A = -10 9 13-12 -8 7 11 15 -14 13 -12 -6 and B = -10 9 -8 7 -6 5 -4 3 -2 E 5 -4 3 -2 1 Explicitly give the values of A2,3, A1,5, and B1,4- Is A a 5 x 3 matrix? Explain your answer. Are A and B (mathematically) equal? Explain your answer.arrow_forwardGiven the following set X = {2, 4, 6, 8} and Y = {1, 2, 3}, explicitly give (e.g., write down the sets with numerical entries) of the outputs of the following requested set operations: (a) [2 points] XUY (Union) (b) [2 points] XY (Intersection) (c) [3 points] X\Y (Difference) (d) [3 points] XAY (Symmetric Difference)arrow_forward
- For what values of k will the equation (k + 1)x² + 6kx + 2k² - x = 0 have: a) one root equal zero b) one root the reciprocal of the other c) roots numerically equal but of opposite signarrow_forward1) Find The inverse The domain of m(x) = tion and of the function The inverse function 3- √x-aarrow_forwardGraph the following function. Please also graph the asymptote. Thank you.arrow_forward
 Algebra and Trigonometry (6th Edition)AlgebraISBN:9780134463216Author:Robert F. BlitzerPublisher:PEARSON
 Contemporary Abstract AlgebraAlgebraISBN:9781305657960Author:Joseph GallianPublisher:Cengage Learning
 Linear Algebra: A Modern IntroductionAlgebraISBN:9781285463247Author:David PoolePublisher:Cengage Learning
 Algebra And Trigonometry (11th Edition)AlgebraISBN:9780135163078Author:Michael SullivanPublisher:PEARSON
 Introduction to Linear Algebra, Fifth EditionAlgebraISBN:9780980232776Author:Gilbert StrangPublisher:Wellesley-Cambridge Press
 College Algebra (Collegiate Math)AlgebraISBN:9780077836344Author:Julie Miller, Donna GerkenPublisher:McGraw-Hill Education