
Essentials Of Statistics For Business & Economics
9th Edition
ISBN: 9780357045435
Author: David R. Anderson, Dennis J. Sweeney, Thomas A. Williams, Jeffrey D. Camm, James J. Cochran
Publisher: South-Western College Pub
expand_more
expand_more
format_list_bulleted
Concept explainers
Videos
Textbook Question
Chapter 10.3, Problem 25E
SAT Scores. The College Board SAT college entrance exam consists of three parts: math, writing, and critical reading. Sample data showing the math and writing scores for a sample of 12 students who took the SAT follow.
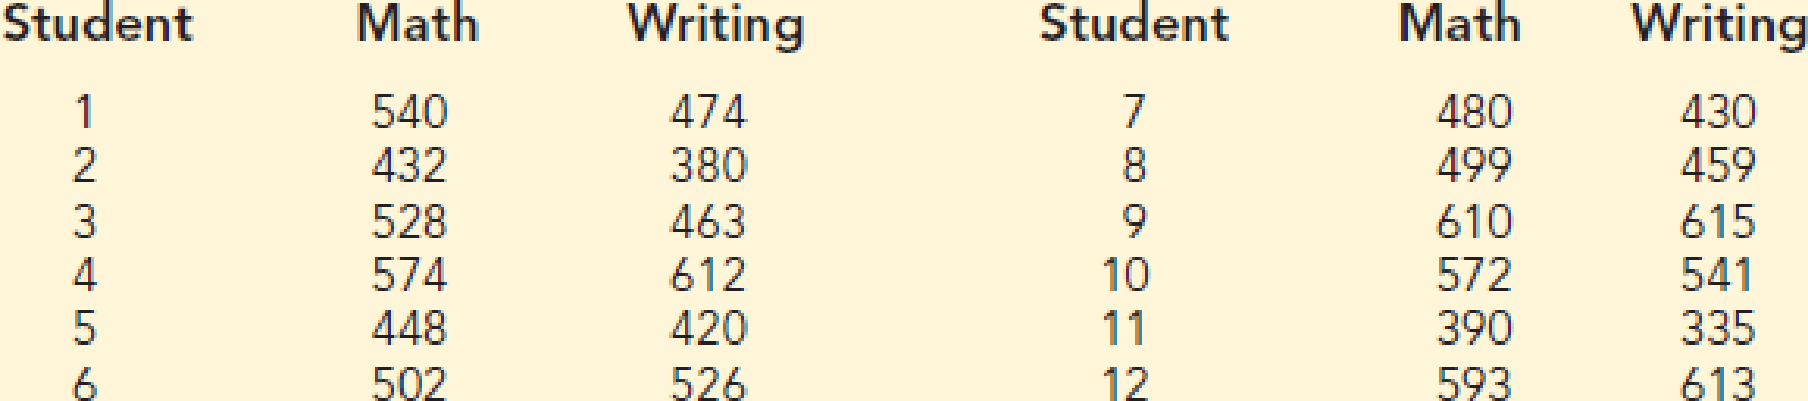
- a. Use a .05 level of significance and test for a difference between the population
mean for the math scores and the population mean for the writing scores. What is the p-value and what is your conclusion? - b. What is the point estimate of the difference between the mean scores for the two tests? What are the estimates of the population mean scores for the two tests? Which test reports the higher mean score?
Expert Solution & Answer

Trending nowThis is a popular solution!

Students have asked these similar questions
29
Suppose that a mound-shaped data set has a
must mean of 10 and standard deviation of 2.
a. About what percentage of the data should
lie between 6 and 12?
b. About what percentage of the data should
lie between 4 and 6?
c. About what percentage of the data should
lie below 4?
91002 175/1
3
2,3,
ample
and
rical
t?
the
28 Suppose that a mound-shaped data set has a
mean of 10 and standard deviation of 2.
a. About what percentage of the data should
lie between 8 and 12?
b. About what percentage of the data should
lie above 10?
c. About what percentage of the data should
lie above 12?
27 Suppose that you have a data set of 1, 2, 2, 3,
3, 3, 4, 4, 5, and you assume that this sample
represents a population. The mean is 3 and g
the standard deviation is 1.225.10
a. Explain why you can apply the empirical
rule to this data set.
b. Where would "most of the values" in the
population fall, based on this data set?
Chapter 10 Solutions
Essentials Of Statistics For Business & Economics
Ch. 10.1 - The following results come from two independent...Ch. 10.1 - 2. Consider the following hypothesis test.
The...Ch. 10.1 - Consider the following hypothesis test....Ch. 10.1 - 4. Condé Nast Traveler conducts an annual survey...Ch. 10.1 - The USA Today reports that the average expenditure...Ch. 10.1 - Hotel Price Comparison. Suppose that you are...Ch. 10.1 - Supermarket Customer Satisfaction. Consumer...Ch. 10.1 - Increases in Customer Satisfaction. Will improving...Ch. 10.2 - The following results are for independent random...Ch. 10.2 - Consider the following hypothesis test:...
Ch. 10.2 - Consider the following data for two independent...Ch. 10.2 - Miles Driven Per Day. The U.S. Department of...Ch. 10.2 - Annual Cost of College. The increasing annual cost...Ch. 10.2 - Salaries of Recent College Graduates. The Tippie...Ch. 10.2 - Hotel Prices. Hotel room pricing changes over time...Ch. 10.2 - Effect of Parents’ Education on Student SAT...Ch. 10.2 - Comparing Financial Consultant Ratings....Ch. 10.2 - Comparing Length of Flight Delays. The success of...Ch. 10.3 - Consider the following hypothesis test.
The...Ch. 10.3 - The following data are from matched samples taken...Ch. 10.3 - Television Commercials and Product Purchase...Ch. 10.3 - First-Quarter Stock Market Performance. The price...Ch. 10.3 - Credit Card Expenditures. Bank of America’s...Ch. 10.3 - Domestic Airfare. The Global Business Travel...Ch. 10.3 - SAT Scores. The College Board SAT college entrance...Ch. 10.3 - PGA Tour Scores. Scores in the first and fourth...Ch. 10.3 - Price Comparison of Smoothie Blenders. A personal...Ch. 10.4 - Consider the following results for independent...Ch. 10.4 - Consider the hypothesis test
The following...Ch. 10.4 - Corporate Hiring Outlook. A Businessweek/Harris...Ch. 10.4 - Impact of Pinterest on Purchase Decisions. Forbes...Ch. 10.4 - Mislabeled Fish. Researchers with Oceana, a group...Ch. 10.4 - Voter Turnout. Minnesota had the highest turnout...Ch. 10.4 - Oil Well Drilling. Oil wells are expensive to...Ch. 10.4 - Hotel Occupancy Rates. Tourism is extremely...Ch. 10.4 - Gender Differences in Raise or Promotion...Ch. 10.4 - Default Rates on Bank Loans. Carl Allen and Norm...Ch. 10 - Supermarket Checkout Lane Design. Safegate Foods,...Ch. 10 - SUV Lease Payments. Statista reports that the...Ch. 10 - Load Versus No-Load Mutal Funds. Mutual funds are...Ch. 10 - Kitchen Versus Bedroom Remodeling Costs. The...Ch. 10 - Effect of Siblings on SAT Scores. In Born...Ch. 10 - Change in Financial Security. Country Financial, a...Ch. 10 - Differences in Insurance Claims Based on Marital...Ch. 10 - Drug-Resistant Gonorrhea. Each year, more than 2...Ch. 10 - News Access Via Computer. The American Press...Ch. 10 - Par, Inc., is a major manufacturer of golf...
Knowledge Booster


Learn more about
Need a deep-dive on the concept behind this application? Look no further. Learn more about this topic, statistics and related others by exploring similar questions and additional content below.Similar questions
- 30 Explain how you can use the empirical rule to find out whether a data set is mound- shaped, using only the values of the data themselves (no histogram available).arrow_forward5. Let X be a positive random variable with finite variance, and let A = (0, 1). Prove that P(X AEX) 2 (1-A)² (EX)² EX2arrow_forward6. Let, for p = (0, 1), and xe R. X be a random variable defined as follows: P(X=-x) = P(X = x)=p. P(X=0)= 1-2p. Show that there is equality in Chebyshev's inequality for X. This means that Chebyshev's inequality, in spite of being rather crude, cannot be improved without additional assumptions.arrow_forward
- 4. Prove that, for any random variable X, the minimum of EIX-al is attained for a = med (X).arrow_forward8. Recall, from Sect. 2.16.4, the likelihood ratio statistic, Ln, which was defined as a product of independent, identically distributed random variables with mean 1 (under the so-called null hypothesis), and the, sometimes more convenient, log-likelihood, log L, which was a sum of independent, identically distributed random variables, which, however, do not have mean log 1 = 0. (a) Verify that the last claim is correct, by proving the more general statement, namely that, if Y is a non-negative random variable with finite mean, then E(log Y) log(EY). (b) Prove that, in fact, there is strict inequality: E(log Y) < log(EY), unless Y is degenerate. (c) Review the proof of Jensen's inequality, Theorem 5.1. Generalize with a glimpse on (b).arrow_forward3. Prove that, for any random variable X, the minimum of E(X - a)² is attained for a = EX. Provedarrow_forward
- 7. Cantelli's inequality. Let X be a random variable with finite variance, o². (a) Prove that, for x ≥ 0, P(X EX2x)≤ 02 x² +0² 202 P(|X - EX2x)<≤ (b) Find X assuming two values where there is equality. (c) When is Cantelli's inequality better than Chebyshev's inequality? (d) Use Cantelli's inequality to show that med (X) - EX ≤ o√√3; recall, from Proposition 6.1, that an application of Chebyshev's inequality yields the bound o√√2. (e) Generalize Cantelli's inequality to moments of order r 1.arrow_forwardThe college hiking club is having a fundraiser to buy new equipment for fall and winter outings. The club is selling Chinese fortune cookies at a price of $2 per cookie. Each cookie contains a piece of paper with a different number written on it. A random drawing will determine which number is the winner of a dinner for two at a local Chinese restaurant. The dinner is valued at $32. Since fortune cookies are donated to the club, we can ignore the cost of the cookies. The club sold 718 cookies before the drawing. Lisa bought 13 cookies. Lisa's expected earnings can be found by multiplying the value of the dinner by the probability that she will win. What are Lisa's expected earnings? Round your answer to the nearest cent.arrow_forwardThe Honolulu Advertiser stated that in Honolulu there was an average of 659 burglaries per 400,000 households in a given year. In the Kohola Drive neighborhood there are 321 homes. Let r be the number of homes that will be burglarized in a year. Use the formula for Poisson distribution. What is the value of p, the probability of success, to four decimal places?arrow_forward
- The college hiking club is having a fundraiser to buy new equipment for fall and winter outings. The club is selling Chinese fortune cookies at a price of $2 per cookie. Each cookie contains a piece of paper with a different number written on it. A random drawing will determine which number is the winner of a dinner for two at a local Chinese restaurant. The dinner is valued at $32. Since fortune cookies are donated to the club, we can ignore the cost of the cookies. The club sold 718 cookies before the drawing. Lisa bought 13 cookies. Lisa's expected earnings can be found by multiplying the value of the dinner by the probability that she will win. What are Lisa's expected earnings? Round your answer to the nearest cent.arrow_forwardWhat was the age distribution of nurses in Great Britain at the time of Florence Nightingale? Thanks to Florence Nightingale and the British census of 1851, we have the following information (based on data from the classic text Notes on Nursing, by Florence Nightingale). Note: In 1851 there were 25,466 nurses in Great Britain. Furthermore, Nightingale made a strict distinction between nurses and domestic servants. Use a histogram and graph the probability distribution. Using the graph of the probability distribution determine the probability that a British nurse selected at random in 1851 would be 40 years of age or older. Round your answer to nearest thousandth. Age range (yr) 20–29 30–39 40–49 50–59 60–69 70–79 80+ Midpoint (x) 24.5 34.5 44.5 54.5 64.5 74.5 84.5 Percent of nurses 5.7% 9.7% 19.5% 29.2% 25.0% 9.1% 1.8%arrow_forwardWhat was the age distribution of nurses in Great Britain at the time of Florence Nightingale? Thanks to Florence Nightingale and the British census of 1851, we have the following information (based on data from the classic text Notes on Nursing, by Florence Nightingale). Note: In 1851 there were 25,466 nurses in Great Britain. Furthermore, Nightingale made a strict distinction between nurses and domestic servants. Use a histogram and graph the probability distribution. Using the graph of the probability distribution determine the probability that a British nurse selected at random in 1851 would be 40 years of age or older. Round your answer to nearest thousandth. Age range (yr) 20–29 30–39 40–49 50–59 60–69 70–79 80+ Midpoint (x) 24.5 34.5 44.5 54.5 64.5 74.5 84.5 Percent of nurses 5.7% 9.7% 19.5% 29.2% 25.0% 9.1% 1.8%arrow_forward
arrow_back_ios
SEE MORE QUESTIONS
arrow_forward_ios
Recommended textbooks for you
 Big Ideas Math A Bridge To Success Algebra 1: Stu...AlgebraISBN:9781680331141Author:HOUGHTON MIFFLIN HARCOURTPublisher:Houghton Mifflin Harcourt
 Holt Mcdougal Larson Pre-algebra: Student Edition...AlgebraISBN:9780547587776Author:HOLT MCDOUGALPublisher:HOLT MCDOUGAL
 Glencoe Algebra 1, Student Edition, 9780079039897...AlgebraISBN:9780079039897Author:CarterPublisher:McGraw Hill
Big Ideas Math A Bridge To Success Algebra 1: Stu...
Algebra
ISBN:9781680331141
Author:HOUGHTON MIFFLIN HARCOURT
Publisher:Houghton Mifflin Harcourt
Holt Mcdougal Larson Pre-algebra: Student Edition...
Algebra
ISBN:9780547587776
Author:HOLT MCDOUGAL
Publisher:HOLT MCDOUGAL
Glencoe Algebra 1, Student Edition, 9780079039897...
Algebra
ISBN:9780079039897
Author:Carter
Publisher:McGraw Hill
Hypothesis Testing - Solving Problems With Proportions; Author: The Organic Chemistry Tutor;https://www.youtube.com/watch?v=76VruarGn2Q;License: Standard YouTube License, CC-BY
Hypothesis Testing and Confidence Intervals (FRM Part 1 – Book 2 – Chapter 5); Author: Analystprep;https://www.youtube.com/watch?v=vth3yZIUlGQ;License: Standard YouTube License, CC-BY