
A PROBLEM SOLVING APPROACH TO MATHEMATI
13th Edition
ISBN: 9780135960363
Author: BILLSTEIN
Publisher: PEARSON
expand_more
expand_more
format_list_bulleted
Videos
Textbook Question
Chapter 10.2B, Problem 12A
The graph below shows the number of books read by
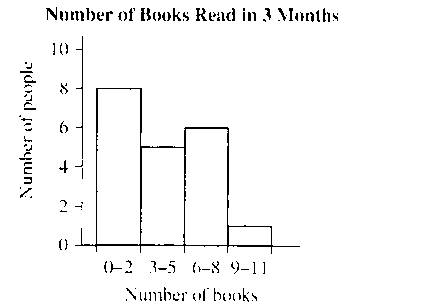
a. How many people read
b. How many people read more than 5 books?
c. What would you estimate for the average number of books read by a person in this club?
Expert Solution & Answer
Want to see the full answer?
Check out a sample textbook solution
Students have asked these similar questions
30 Explain how you can use the empirical rule
to find out whether a data set is mound-
shaped, using only the values of the data
themselves (no histogram available).
5. Let X be a positive random variable with finite variance, and let A = (0, 1).
Prove that
P(X AEX) 2 (1-A)² (EX)²
EX2
6. Let, for p = (0, 1), and xe R. X be a random variable defined as follows:
P(X=-x) = P(X = x)=p. P(X=0)= 1-2p.
Show that there is equality in Chebyshev's inequality for X.
This means that Chebyshev's inequality, in spite of being rather crude, cannot be
improved without additional assumptions.
Chapter 10 Solutions
A PROBLEM SOLVING APPROACH TO MATHEMATI
Ch. 10.1 - Suggest how students at different grades might...Ch. 10.1 - Mathematical Connections What are the Nielsen...Ch. 10.1 - Prob. 4MCCh. 10.1 - Read about basic ideas of statistics in Common...Ch. 10.1 - National Assessment of Educational ProgressNAEP...Ch. 10.1 - Prob. 2NAEPCh. 10.1 - Prob. 3NAEPCh. 10.1A - If one wanted to study the effect of using a...Ch. 10.1A - Prob. 2ACh. 10.1A - Prob. 3A
Ch. 10.1A - Prob. 4ACh. 10.1A - Prob. 5ACh. 10.1A - Prob. 6ACh. 10.1A - A second-grade class has a project to determine...Ch. 10.1A - Prob. 8ACh. 10.1A - Prob. 9ACh. 10.1A - Decide whether each of the following questions is...Ch. 10.1A - Prob. 11ACh. 10.1A - If a class were to investigate how many countries...Ch. 10.1A - Prob. 13ACh. 10.1A - In a set of student evaluations of their...Ch. 10.1A - If a bar graph like the one shown here were used...Ch. 10.1A - Prob. 16ACh. 10.1B - Assessment To study the effect of student...Ch. 10.1B - Assessment If students are measuring a tablespoon...Ch. 10.1B - Assessment If third graders were measuring an...Ch. 10.1B - Assessment To determine student computer use,...Ch. 10.1B - Suppose a poll is to be conducted in an elementary...Ch. 10.1B - Determine the population and the sample in the...Ch. 10.1B - A second-grade class has a project to determine...Ch. 10.1B - An elementary school class decides to determine...Ch. 10.1B - Prob. 12ACh. 10.1B - Prob. 13ACh. 10.1B - Assessment A university professor used a rating...Ch. 10.1B - Prob. 15ACh. 10.2 - Mathematical Connections a. Discuss when a...Ch. 10.2 - Mathematical Connections Explain whether a circle...Ch. 10.2 - Mathematical Connections Explain why the sum of...Ch. 10.2 - Mathematical Connections The federal budget for...Ch. 10.2 - Mathematical Connections Tell whether it is...Ch. 10.2 - Mathematical Connections Car sales from 1990 to...Ch. 10.2 - Mathematical Connections Find five examples of...Ch. 10.2 - Mathematical Connections A graph similar to the...Ch. 10.2 - Mathematical Connections Vale asks whether a stem...Ch. 10.2 - Mathematical Connections A histogram of the data...Ch. 10.2 - Mathematical Connections Paul asks how to create a...Ch. 10.2 - Mathematical Connections On the School Book Page...Ch. 10.2 - Prob. 15MCCh. 10.2 - Answer the Try It on the School Book Page on page...Ch. 10.2 - Answer the Try It on the School Book Page on page...Ch. 10.2 - National Assessment of Educational Progress NAEP...Ch. 10.2 - National Assessment of Educational Progress NAEP...Ch. 10.2 - National Assessment of Educational Progress NAEP...Ch. 10.2 - National Assessment of Educational Progress NAEP...Ch. 10.2 - National Assessment of Educational Progress NAEP...Ch. 10.2A - The following the pictograph shows the approximate...Ch. 10.2A - Prob. 2ACh. 10.2A - Prob. 3ACh. 10.2A - Sixth grade students reported the numbers of apps...Ch. 10.2A - Prob. 5ACh. 10.2A - Prob. 6ACh. 10.2A - Prob. 7ACh. 10.2A - Prob. 8ACh. 10.2A - Prob. 9ACh. 10.2A - Prob. 10ACh. 10.2A - Prob. 11ACh. 10.2A - Prob. 12ACh. 10.2A - Prob. 13ACh. 10.2A - a. A 2-inch-long rectangle serves as a percentage...Ch. 10.2A - Seniors Sierra High were asked to about their...Ch. 10.2A - Prob. 16ACh. 10.2A - Prob. 17ACh. 10.2A - Prob. 18ACh. 10.2B - The following pictograph shows the approximate...Ch. 10.2B - Display the following information about the status...Ch. 10.2B - In the figure shown, monthly sales of three...Ch. 10.2B - Prob. 4ACh. 10.2B - A list of presidents, with the number of children...Ch. 10.2B - Prob. 6ACh. 10.2B - The heights reached by 15 model rockets launched...Ch. 10.2B - Prob. 8ACh. 10.2B - Given the following bar graph, estimate the length...Ch. 10.2B - Prob. 10ACh. 10.2B - Prob. 11ACh. 10.2B - The graph below shows the number of books read by...Ch. 10.2B - Prob. 13ACh. 10.2B - Use the circle graph to answer the following...Ch. 10.2B - a. In a circle graph, a sector containing 82...Ch. 10.2B - A percentage bar graph with 100 is drawn to depict...Ch. 10.2B - Prob. 17ACh. 10.2B - Prob. 18ACh. 10.3 - Explain the concept of association as it is...Ch. 10.3 - Jacquie argued that scatterplots had little value...Ch. 10.3 - Prob. 6MCCh. 10.3 - The Garcia family drew a circle graph of their...Ch. 10.3 - Prob. 9MCCh. 10.3 - Prob. 10MCCh. 10.3 - A teacher surveyed 8 students in a class to find...Ch. 10.3 - Prob. 2NAEPCh. 10.3A - Assessment The graph below shows the population of...Ch. 10.3A - Assessment The graph shows the number of snow...Ch. 10.3A - Assessment The graph shows the US rates of adult...Ch. 10.3A - Prob. 5ACh. 10.3A - Prob. 6ACh. 10.3A - Prob. 7ACh. 10.3A - Assessment Consider an arithmetic sequence with...Ch. 10.3A - Prob. 9ACh. 10.3A - Assessment In the following scatterplots, find an...Ch. 10.3A - Assessment The following data show the amount of...Ch. 10.3A - Assessment If a trend line has equation...Ch. 10.3A - Assessment If a trend line has equation y=150.8x,...Ch. 10.3A - Assessment For each of the following pairs of...Ch. 10.3B - Prob. 1ACh. 10.3B - Prob. 2ACh. 10.3B - Prob. 3ACh. 10.3B - Prob. 4ACh. 10.3B - Prob. 5ACh. 10.3B - Prob. 6ACh. 10.3B - Prob. 7ACh. 10.3B - Prob. 8ACh. 10.3B - Prob. 9ACh. 10.3B - Prob. 10ACh. 10.3B - Prob. 11ACh. 10.3B - Prob. 12ACh. 10.3B - Prob. 13ACh. 10.3B - Assessment If a trend line has equation...Ch. 10.3B - Assessment For each of the following pairs of...Ch. 10.4 - Mathematical Connections Karl had scores of...Ch. 10.4 - The mean of the five numbers given is 50: 20 35 50...Ch. 10.4 - Prob. 6MCCh. 10.4 - Mathematical Connections Explain why the mode...Ch. 10.4 - Prob. 8MCCh. 10.4 - Mathematical Connections The mean of 5,7,9 is 7....Ch. 10.4 - Mathematical Connections If each number in a set...Ch. 10.4 - Mathematical Connections What does a large...Ch. 10.4 - Mathematical Connections In each pair of variables...Ch. 10.4 - Mathematical Connections Use the data in the...Ch. 10.4 - Mathematical Connections A student asks, If the...Ch. 10.4 - Mathematical Connections Jose asks, Why can a...Ch. 10.4 - Mathematical Connections Suppose the class takes a...Ch. 10.4 - Mathematical Connections A student asks if it is...Ch. 10.4 - Prob. 19MCCh. 10.4 - Mathematical Connections A student asks if it is...Ch. 10.4 - Mathematical Connections Mels mean on 10 tests for...Ch. 10.4 - Mathematical Connections On the School Book Page,...Ch. 10.4 - Prob. 25MCCh. 10.4 - Mathematical Connections Given the bar graph...Ch. 10.4 - Mathematical Connections Refer to the following...Ch. 10.4 - Mathematical Connections Following are raw test...Ch. 10.4 - Josephs current test scores, in points, are 83,...Ch. 10.4 - National Assessment of Educational Progress NAEP...Ch. 10.4 - Prob. 3NAEPCh. 10.4 - Richard wants to estimate the average mean monthly...Ch. 10.4A - Assessment Calculate the mean, the median, and the...Ch. 10.4A - Prob. 2ACh. 10.4A - Assessment a. If three students scored 75 on a...Ch. 10.4A - Prob. 4ACh. 10.4A - Assessment Suppose in Selinas class there were...Ch. 10.4A - Prob. 6ACh. 10.4A - Prob. 7ACh. 10.4A - Prob. 8ACh. 10.4A - Prob. 9ACh. 10.4A - Prob. 10ACh. 10.4A - Prob. 11ACh. 10.4A - Assessment The city of Podunk advertised itself as...Ch. 10.4A - Prob. 13ACh. 10.4A - Prob. 14ACh. 10.4A - Prob. 15ACh. 10.4A - Assessment Following are box plots comparing the...Ch. 10.4A - Prob. 17ACh. 10.4A - Assessment The following table shows the heights...Ch. 10.4A - Assessment What is the standard deviation of the...Ch. 10.4A - Prob. 20ACh. 10.4A - Prob. 21ACh. 10.4A - Assessment The average phone call in a certain...Ch. 10.4A - Prob. 23ACh. 10.4A - Prob. 24ACh. 10.4A - Prob. 25ACh. 10.4A - Prob. 26ACh. 10.4A - Prob. 27ACh. 10.4A - Prob. 28ACh. 10.4B - Calculate the mean, the median, and the mode for...Ch. 10.4B - Prob. 2ACh. 10.4B - Prob. 3ACh. 10.4B - Prob. 4ACh. 10.4B - Prob. 5ACh. 10.4B - Prob. 6ACh. 10.4B - Prob. 7ACh. 10.4B - Prob. 9ACh. 10.4B - Prob. 10ACh. 10.4B - Prob. 11ACh. 10.4B - Prob. 12ACh. 10.4B - Prob. 13ACh. 10.4B - Prob. 14ACh. 10.4B - Ginnys median score on three tests was 90. Her...Ch. 10.4B - Prob. 16ACh. 10.4B - Prob. 17ACh. 10.4B - The following table shows the heights in feet of...Ch. 10.4B - a. If all the numbers in a set are equal, what is...Ch. 10.4B - In a school system, teachers start at a salary of...Ch. 10.4B - Prob. 21ACh. 10.4B - Prob. 22ACh. 10.4B - Prob. 23ACh. 10.4B - Prob. 24ACh. 10.4B - The weights of newborn babies in a certain country...Ch. 10.4B - Prob. 26ACh. 10.4B - Prob. 27ACh. 10.4B - Prob. 28ACh. 10.4B - Prob. 29ACh. 10.CR - Suppose you read that the average family in...Ch. 10.CR - Prob. 2CRCh. 10.CR - Prob. 3CRCh. 10.CR - Prob. 5CRCh. 10.CR - Prob. 6CRCh. 10.CR - The budget for the Wegetem Crime Co. is 2,000,000....Ch. 10.CR - Prob. 8CRCh. 10.CR - Prob. 9CRCh. 10.CR - Prob. 11CRCh. 10.CR - Prob. 12CRCh. 10.CR - Prob. 13CRCh. 10.CR - Prob. 14CRCh. 10.CR - CHAPTER 10 REVIEW The following chart lists the...Ch. 10.CR - Prob. 16CRCh. 10.CR - Prob. 17CRCh. 10.CR - Prob. 19CRCh. 10.CR - Prob. 20CRCh. 10.CR - Prob. 21CRCh. 10.CR - Prob. 22CRCh. 10.CR - Prob. 24CRCh. 10.CR - CHAPTER 10 REVIEW Following are the record...Ch. 10.CR - Prob. 26CRCh. 10.CR - Prob. 27CRCh. 10.CR - Prob. 28CRCh. 10.CR - Prob. 29CRCh. 10.CR - Prob. 30CRCh. 10.CR - Prob. 32CRCh. 10.CR - CHAPTER 10 REVIEW Give examples of several ways to...Ch. 10.CR - Prob. 34CRCh. 10.CR - Prob. 35CRCh. 10.CR - Prob. 36CRCh. 10.CR - Prob. 37CRCh. 10 - Prob. 1NTCh. 10 - Prob. 2NTCh. 10 - Prob. 4NTCh. 10 - Prob. 5NTCh. 10 - Prob. 6NTCh. 10 - Prob. 7NTCh. 10 - Prob. 8NT
Knowledge Booster


Learn more about
Need a deep-dive on the concept behind this application? Look no further. Learn more about this topic, subject and related others by exploring similar questions and additional content below.Similar questions
- 4. Prove that, for any random variable X, the minimum of EIX-al is attained for a = med (X).arrow_forward8. Recall, from Sect. 2.16.4, the likelihood ratio statistic, Ln, which was defined as a product of independent, identically distributed random variables with mean 1 (under the so-called null hypothesis), and the, sometimes more convenient, log-likelihood, log L, which was a sum of independent, identically distributed random variables, which, however, do not have mean log 1 = 0. (a) Verify that the last claim is correct, by proving the more general statement, namely that, if Y is a non-negative random variable with finite mean, then E(log Y) log(EY). (b) Prove that, in fact, there is strict inequality: E(log Y) < log(EY), unless Y is degenerate. (c) Review the proof of Jensen's inequality, Theorem 5.1. Generalize with a glimpse on (b).arrow_forward2. Derive the component transformation equations for tensors shown be- low where [C] = [BA] is the direction cosine matrix from frame A to B. B[T] = [C]^[T][C]T 3. The transport theorem for vectors shows that the time derivative can be constructed from two parts: the first is an explicit frame-dependent change of the vector whereas the second is an active rotational change of the vector. The same holds true for tensors. Starting from the previous result, derive a version of transport theorem for tensors. [C] (^[T])[C] = dt d B dt B [T] + [WB/A]B[T] – TWB/A] (10 pt) (7pt)arrow_forward
- Use the graph of the function y = f (x) to find the value, if possible. f(x) 8 7 6 Q5 y 3 2 1 x -8 -7 -6 -5 -4 -3 -2 -1 1 2 3 4 5 6 7 8 -1 -2 -3 -4 -5 -6 -7 -8+ Olim f(z) x-1+ O Limit does not exist.arrow_forward3. Prove that, for any random variable X, the minimum of E(X - a)² is attained for a = EX. Provedarrow_forwardShade the areas givenarrow_forward
- 7. Cantelli's inequality. Let X be a random variable with finite variance, o². (a) Prove that, for x ≥ 0, P(X EX2x)≤ 02 x² +0² 202 P(|X - EX2x)<≤ (b) Find X assuming two values where there is equality. (c) When is Cantelli's inequality better than Chebyshev's inequality? (d) Use Cantelli's inequality to show that med (X) - EX ≤ o√√3; recall, from Proposition 6.1, that an application of Chebyshev's inequality yields the bound o√√2. (e) Generalize Cantelli's inequality to moments of order r 1.arrow_forwardThe college hiking club is having a fundraiser to buy new equipment for fall and winter outings. The club is selling Chinese fortune cookies at a price of $2 per cookie. Each cookie contains a piece of paper with a different number written on it. A random drawing will determine which number is the winner of a dinner for two at a local Chinese restaurant. The dinner is valued at $32. Since fortune cookies are donated to the club, we can ignore the cost of the cookies. The club sold 718 cookies before the drawing. Lisa bought 13 cookies. Lisa's expected earnings can be found by multiplying the value of the dinner by the probability that she will win. What are Lisa's expected earnings? Round your answer to the nearest cent.arrow_forwardThe Honolulu Advertiser stated that in Honolulu there was an average of 659 burglaries per 400,000 households in a given year. In the Kohola Drive neighborhood there are 321 homes. Let r be the number of homes that will be burglarized in a year. Use the formula for Poisson distribution. What is the value of p, the probability of success, to four decimal places?arrow_forward
- The college hiking club is having a fundraiser to buy new equipment for fall and winter outings. The club is selling Chinese fortune cookies at a price of $2 per cookie. Each cookie contains a piece of paper with a different number written on it. A random drawing will determine which number is the winner of a dinner for two at a local Chinese restaurant. The dinner is valued at $32. Since fortune cookies are donated to the club, we can ignore the cost of the cookies. The club sold 718 cookies before the drawing. Lisa bought 13 cookies. Lisa's expected earnings can be found by multiplying the value of the dinner by the probability that she will win. What are Lisa's expected earnings? Round your answer to the nearest cent.arrow_forwardWhat was the age distribution of nurses in Great Britain at the time of Florence Nightingale? Thanks to Florence Nightingale and the British census of 1851, we have the following information (based on data from the classic text Notes on Nursing, by Florence Nightingale). Note: In 1851 there were 25,466 nurses in Great Britain. Furthermore, Nightingale made a strict distinction between nurses and domestic servants. Use a histogram and graph the probability distribution. Using the graph of the probability distribution determine the probability that a British nurse selected at random in 1851 would be 40 years of age or older. Round your answer to nearest thousandth. Age range (yr) 20–29 30–39 40–49 50–59 60–69 70–79 80+ Midpoint (x) 24.5 34.5 44.5 54.5 64.5 74.5 84.5 Percent of nurses 5.7% 9.7% 19.5% 29.2% 25.0% 9.1% 1.8%arrow_forwardWhat was the age distribution of nurses in Great Britain at the time of Florence Nightingale? Thanks to Florence Nightingale and the British census of 1851, we have the following information (based on data from the classic text Notes on Nursing, by Florence Nightingale). Note: In 1851 there were 25,466 nurses in Great Britain. Furthermore, Nightingale made a strict distinction between nurses and domestic servants. Use a histogram and graph the probability distribution. Using the graph of the probability distribution determine the probability that a British nurse selected at random in 1851 would be 40 years of age or older. Round your answer to nearest thousandth. Age range (yr) 20–29 30–39 40–49 50–59 60–69 70–79 80+ Midpoint (x) 24.5 34.5 44.5 54.5 64.5 74.5 84.5 Percent of nurses 5.7% 9.7% 19.5% 29.2% 25.0% 9.1% 1.8%arrow_forward
arrow_back_ios
SEE MORE QUESTIONS
arrow_forward_ios
Recommended textbooks for you
 Holt Mcdougal Larson Pre-algebra: Student Edition...AlgebraISBN:9780547587776Author:HOLT MCDOUGALPublisher:HOLT MCDOUGAL
 Algebra: Structure And Method, Book 1AlgebraISBN:9780395977224Author:Richard G. Brown, Mary P. Dolciani, Robert H. Sorgenfrey, William L. ColePublisher:McDougal Littell
 Glencoe Algebra 1, Student Edition, 9780079039897...AlgebraISBN:9780079039897Author:CarterPublisher:McGraw Hill
 Elementary AlgebraAlgebraISBN:9780998625713Author:Lynn Marecek, MaryAnne Anthony-SmithPublisher:OpenStax - Rice University
 Mathematics For Machine TechnologyAdvanced MathISBN:9781337798310Author:Peterson, John.Publisher:Cengage Learning,
Holt Mcdougal Larson Pre-algebra: Student Edition...
Algebra
ISBN:9780547587776
Author:HOLT MCDOUGAL
Publisher:HOLT MCDOUGAL
Algebra: Structure And Method, Book 1
Algebra
ISBN:9780395977224
Author:Richard G. Brown, Mary P. Dolciani, Robert H. Sorgenfrey, William L. Cole
Publisher:McDougal Littell
Glencoe Algebra 1, Student Edition, 9780079039897...
Algebra
ISBN:9780079039897
Author:Carter
Publisher:McGraw Hill
Elementary Algebra
Algebra
ISBN:9780998625713
Author:Lynn Marecek, MaryAnne Anthony-Smith
Publisher:OpenStax - Rice University
Mathematics For Machine Technology
Advanced Math
ISBN:9781337798310
Author:Peterson, John.
Publisher:Cengage Learning,
2.1 Introduction to inequalities; Author: Oli Notes;https://www.youtube.com/watch?v=D6erN5YTlXE;License: Standard YouTube License, CC-BY
GCSE Maths - What are Inequalities? (Inequalities Part 1) #56; Author: Cognito;https://www.youtube.com/watch?v=e_tY6X5PwWw;License: Standard YouTube License, CC-BY
Introduction to Inequalities | Inequality Symbols | Testing Solutions for Inequalities; Author: Scam Squad Math;https://www.youtube.com/watch?v=paZSN7sV1R8;License: Standard YouTube License, CC-BY