Concept explainers
Videos
For Exercises 28 through 33, do a complete
a. Draw a
b. Compute the
c. State the hypotheses.
d. Test the hypotheses at α = 0.05. Use Table I.
e. Determine the regression line equation if r is significant.
f. Plot the regression line on the scatter plot, if appropriate.
g. Summarize the results.
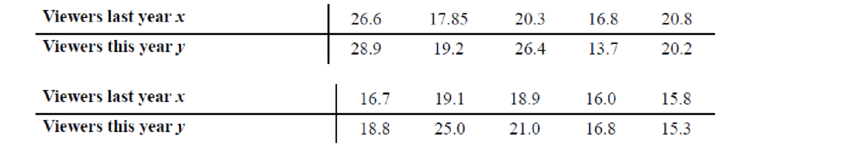
32. Television Viewers A television executive selects 10 television shows and compares the average number of viewers the show had last year with the average number of viewers this year. The data (in millions) are shown. Describe the relationship.
a.
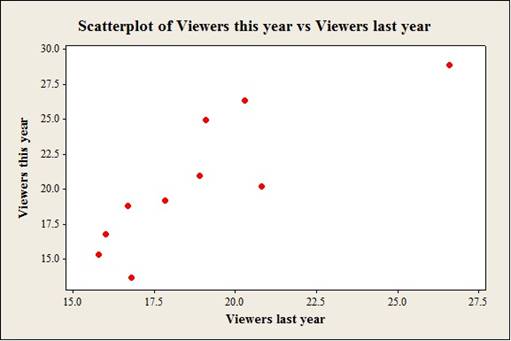
To construct: The scatterplot for the variablesthe average number of viewers the show hadlast year and the average number of viewers this year.
Answer to Problem 32E
Output using the MINITAB software is given below:
Explanation of Solution
Given info:
The data shows the average number of viewers the show hadlast year (x) and the average number of viewers this year(y) values.
Calculation:
Step by step procedure to obtain scatterplot using the MINITAB software:
- Choose Graph > Scatterplot.
- Choose Simple and then click OK.
- Under Y variables, enter a column ofViewers last year.
- Under X variables, enter a column of Viewers this year.
- Click OK.
b.
To compute: The value of the correlation coefficient.
Answer to Problem 32E
The value of the correlation coefficientis 0.839.
Explanation of Solution
Calculation:
Correlation coefficient r:
Software Procedure:
Step-by-step procedure to obtain the ‘correlation coefficient’ using the MINITAB software:
- Select Stat >Basic Statistics > Correlation.
- In Variables, select x and y from the box on the left.
- Click OK.
Output using the MINITAB software is given below:
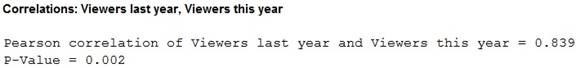
From the MINITAB output, the value of the correlation is 0.839.
c.
To state: The hypothesis.
Answer to Problem 32E
The null hypothesis is
The alternative hypothesis is
Explanation of Solution
Calculation:
The hypotheses are given below:
Null hypothesis:
That is, there is no linear relation betweenthe average number of viewers the show hadlast year and the average number of viewers this year.
Alternative hypothesis:
That is, there is a linear relationbetween the average number of viewers the show hadlast year and the average number of viewers this year.
d.
To test: The significance of the correlation coefficient at
Answer to Problem 32E
The conclusion is that, there is a sufficient evidence to support the claim that linear relation betweenthe average number of viewers the show had last year and the average number of viewers this year.
Explanation of Solution
Given info:
The level of significance is
Calculation:
The sample size is 10.
The formula to find the degrees of the freedom is
That is,
From the “TABLE –I: Critical Values for the PPMC”, the critical value for 4 degrees of freedom and
Rejection Rule:
If the absolute value of r is greater than the critical value then reject the null hypothesis.
Conclusion:
From part (b), the value of r is0.839 that is the absolute value of r is 0.839.
Here, the absolute value of r is greater than the critical value
That is,
By the rejection rule,reject the null hypothesis.
There is sufficient evidence to support the claim that “there is alinear relation betweenthe average number of viewers the show had last year and the average number of viewers this year”.
e.
To find: The regression equation for the given data.
Answer to Problem 32E
The regression equation for the given datais
Explanation of Solution
Calculation:
Regression:
Software procedure:
Step by step procedure to obtain the regression equation using the MINITAB software:
- Choose Stat > Regression > Regression.
- In Responses, enter the column ofViewers this year.
- In Predictors, enter the column ofViewers last year.
- Click OK.
Output using the MINITAB software is given below:
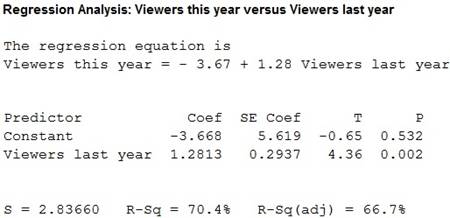
Thus, regression equation for the given datais
f.
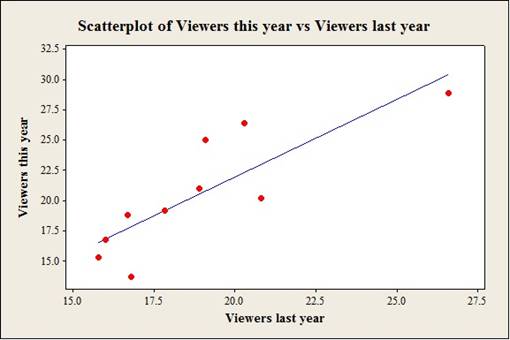
To construct: The scatterplot for the variablesthe average number of viewers the show hadlast year and the average number of viewers this year.
Answer to Problem 32E
Output using the MINITAB software is given below:
Explanation of Solution
Calculation:
Step by step procedure to obtain scatterplot using the MINITAB software:
- Choose Graph > Scatterplot.
- Choose with line and then click OK.
- Under Y variables, enter a column of Viewers last year.
- Under X variables, enter a column of Viewers this year.
- Click OK.
g.
To summarize: The results.
Answer to Problem 32E
Explanation of Solution
Justification:
Thus, there is a sufficient evidence to support the claim that linear relation betweenthe average number of viewers the show had last year and the average number of viewers this year.
h.
To explain: The type of relation.
Answer to Problem 32E
The type of relation is the positivelinear relation.
Explanation of Solution
Justification:
From part (a), it is observed that there is a positive linear relation between the variables.
Thus, it can be conclude that there is the type of the relation is “linear relation”.
Want to see more full solutions like this?
Chapter 10 Solutions
Elementary Statistics: A Step By Step Approach


- Suppose you know that Bob's test score is above the mean, but he doesn't remember by how much. At least how many students must score lower than Bob?arrow_forwardIf a baby's weight is at the median, what's her percentile?arrow_forwardAt the same restaurant as in Question 19 with the same normal distribution, what's the chance of it taking no more than 15 minutes to get service?arrow_forward
- Clint, obviously not in college, sleeps an average of 8 hours per night with a standard deviation of 15 minutes. What's the chance of him sleeping between 7.5 and 8.5 hours on any given night? 0-(7-0) 200 91109s and doiw $20 (8-0) mol 8520 slang $199 galbrog seam side pide & D (newid se od poyesvig as PELEO PER AFTE editiw noudab temand van Czarrow_forwardTimes to complete a statistics exam have a normal distribution with a mean of 40 minutes and standard deviation of 6 minutes. Deshawn's time comes in at the 90th percentile. What percentage of the students are still working on their exams when Deshawn leaves?arrow_forwardSuppose that the weights of cereal boxes have a normal distribution with a mean of 20 ounces and standard deviation of half an ounce. A box that has a standard score of o weighs how much? syed by ilog ni 21arrow_forward
- Bob scores 80 on both his math exam (which has a mean of 70 and standard deviation of 10) and his English exam (which has a mean of 85 and standard deviation of 5). Find and interpret Bob's Z-scores on both exams to let him know which exam (if either) he did bet- ter on. Don't, however, let his parents know; let them think he's just as good at both subjects. algas 70) sering digarrow_forwardSue's math class exam has a mean of 70 with a standard deviation of 5. Her standard score is-2. What's her original exam score?arrow_forwardClint sleeps an average of 8 hours per night with a standard deviation of 15 minutes. What's the chance he will sleep less than 7.5 hours tonight? nut bow visarrow_forward
- Suppose that your score on an exam is directly at the mean. What's your standard score?arrow_forwardOne state's annual rainfall has a normal dis- tribution with a mean of 100 inches and standard deviation of 25 inches. Suppose that corn grows best when the annual rainfall is between 100 and 150 inches. What's the chance of achieving this amount of rainfall? wved now of sociarrow_forward13 Suppose that your exam score has a standard score of 0.90. Does this mean that 90 percent of the other exam scores are lower than yours?arrow_forward
 Glencoe Algebra 1, Student Edition, 9780079039897...AlgebraISBN:9780079039897Author:CarterPublisher:McGraw Hill
 Functions and Change: A Modeling Approach to Coll...AlgebraISBN:9781337111348Author:Bruce Crauder, Benny Evans, Alan NoellPublisher:Cengage Learning
 Big Ideas Math A Bridge To Success Algebra 1: Stu...AlgebraISBN:9781680331141Author:HOUGHTON MIFFLIN HARCOURTPublisher:Houghton Mifflin Harcourt
 Algebra and Trigonometry (MindTap Course List)AlgebraISBN:9781305071742Author:James Stewart, Lothar Redlin, Saleem WatsonPublisher:Cengage Learning
 College AlgebraAlgebraISBN:9781305115545Author:James Stewart, Lothar Redlin, Saleem WatsonPublisher:Cengage Learning
 Holt Mcdougal Larson Pre-algebra: Student Edition...AlgebraISBN:9780547587776Author:HOLT MCDOUGALPublisher:HOLT MCDOUGAL