
Concept explainers
Videos
The verification of
Explanation of Solution
To find the required statistics using the Minitab, follow the below instructions:
Step 1: Go to the Minitab software.
Step 2: Go to Stat > Basic statistics > Display
Step 3: Select dataset ‘Field A’ and dataset ‘Field B’ in variables.
Step 4: Click on OK.
The obtained output is:
Statistics
| Variable | N | N* | SE Mean | StDev | Minimum | Q1 | Q3 | Maximum | ||
| Sample 1 | 7 | 0 | 4.000 | 0.900 | 2.380 | 2.000 | 2.000 | 3.000 | 6.000 | 8.000 |
| Sample 2 | 8 | 0 | 5.500 | 0.982 | 2.777 | 2.000 | 3.000 | 5.500 | 7.750 | 10.000 |
From the above output we have find that the values of
(a)
(i)
The level of significance, null hypothesis and alternate hypothesis.
(a)
(i)
Answer to Problem 22P
Solution: The hypotheses are
Explanation of Solution
The level of significance is 0.05.Since, we want to conduct a test of the claim that population mean time lost due to stressors is greater than the population mean time lost due to intimidators. Therefore the null hypothesis is
(ii)
To find: The sampling distribution that should be used along with assumptions and compute the value of the sample test statistic.
(ii)
Answer to Problem 22P
Solution: We can use student’s t distribution. The sample test statisticis
Explanation of Solution
Calculation:
Let’s assume that the population distributions of time lost due to intimidators and time lost due to stressors are each mound shape and approximately symmetrical. The population standard deviation (
Using
The sample test statistic t is calculated as follows:
Thus the test statistic is
(iii)
To find: The P-value of the test statistic and sketch the sampling distribution showing the area corresponding to the P-value.
(iii)
Answer to Problem 22P
Solution: The P-value of the sample test statistic is 0.1508.
Explanation of Solution
Calculation:
The given hypothesis test is two tailed.
D.F = Smaller of
By using table 4 from Appendix
Graph:
To draw the required graphs using the Minitab, follow the below instructions:
Step 1: Go to the Minitab software.
Step 2: Go to Graph > Probability distribution plot > View probability.
Step 3: Select ‘t’ and enter D.f = 6.
Step 4: Click on the Shaded area > X value.
Step 5: Enter X-value as -1.13 and select ‘Left tail’.
Step 6: Click on OK.
The obtained distribution graph is:
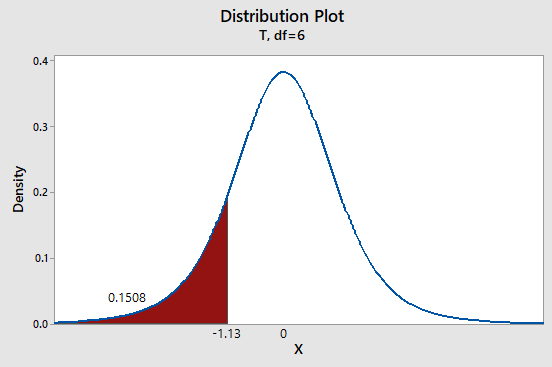
P-value = 0.1508
(iv)
Whether we reject or fail to reject the null hypothesis and whether the data is statistically significant for a level of significance of 0.05.
(iv)
Answer to Problem 22P
Solution: The P-value
Explanation of Solution
The P-value (0.1508) is greater than the level of significance (
(v)
The interpretation for the conclusion.
(v)
Answer to Problem 22P
Solution: There is not enough evidence to conclude that population mean time lost due to stressors is greater than the population mean time lost due to intimidators.
Explanation of Solution
The P-value (0.1508) is greater than the level of significance (
(b)
To find: The 90%confidence interval for
(b)
Answer to Problem 22P
Solution:
The 90% confidence interval for the difference of two means is
Explanation of Solution
Calculation:
The critical t-value for a two-tailed area of 0.10 is 1.943.
The difference of two means is
Now, the margin of error is computed as follows:
Now the confidence interval for the difference of two means;
The confidence interval for the difference of two means is
Interpretation:
At the 90% confidence level, we see that the difference of means
Want to see more full solutions like this?
Chapter 10 Solutions
Bundle: Understanding Basic Statistics, Loose-leaf Version, 7th + WebAssign Printed Access Card for Brase/Brase's Understanding Basic Statistics, ... for Peck's Statistics: Learning from Data


- A marketing agency wants to determine whether different advertising platforms generate significantly different levels of customer engagement. The agency measures the average number of daily clicks on ads for three platforms: Social Media, Search Engines, and Email Campaigns. The agency collects data on daily clicks for each platform over a 10-day period and wants to test whether there is a statistically significant difference in the mean number of daily clicks among these platforms. Conduct ANOVA test. You can provide your answer by inserting a text box and the answer must include: also please provide a step by on getting the answers in excel Null hypothesis, Alternative hypothesis, Show answer (output table/summary table), and Conclusion based on the P value.arrow_forwardA company found that the daily sales revenue of its flagship product follows a normal distribution with a mean of $4500 and a standard deviation of $450. The company defines a "high-sales day" that is, any day with sales exceeding $4800. please provide a step by step on how to get the answers Q: What percentage of days can the company expect to have "high-sales days" or sales greater than $4800? Q: What is the sales revenue threshold for the bottom 10% of days? (please note that 10% refers to the probability/area under bell curve towards the lower tail of bell curve) Provide answers in the yellow cellsarrow_forwardBusiness Discussarrow_forward
- The following data represent total ventilation measured in liters of air per minute per square meter of body area for two independent (and randomly chosen) samples. Analyze these data using the appropriate non-parametric hypothesis testarrow_forwardeach column represents before & after measurements on the same individual. Analyze with the appropriate non-parametric hypothesis test for a paired design.arrow_forwardShould you be confident in applying your regression equation to estimate the heart rate of a python at 35°C? Why or why not?arrow_forward
- Given your fitted regression line, what would be the residual for snake #5 (10 C)?arrow_forwardCalculate the 95% confidence interval around your estimate of r using Fisher’s z-transformation. In your final answer, make sure to back-transform to the original units.arrow_forwardCalculate Pearson’s correlation coefficient (r) between temperature and heart rate.arrow_forward
 Glencoe Algebra 1, Student Edition, 9780079039897...AlgebraISBN:9780079039897Author:CarterPublisher:McGraw Hill
 College Algebra (MindTap Course List)AlgebraISBN:9781305652231Author:R. David Gustafson, Jeff HughesPublisher:Cengage Learning