Pearson eText for An Introduction to Mathematical Statistics and Its Applications -- Instant Access (Pearson+)
6th Edition
ISBN: 9780137549375
Author: Richard Larsen, Morris Marx
Publisher: PEARSON+
expand_more
expand_more
format_list_bulleted
Concept explainers
Videos
Textbook Question
Chapter 10.2, Problem 1Q
The Advanced Placement Program allows high school students to enroll in special classes in which a subject is studied at the college level. Proficiency is measured by a national examination. Universities typically grant course credit for a sufficiently strong performance. The possible scores are 1,2,3,4, and 5 with 5 being the highest. The following table gives the probabilities associated with the scores made on a Calculus BC test:
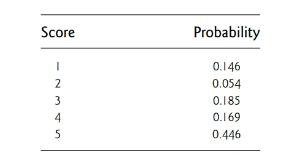
Suppose six students from class take the test. What is the
Expert Solution & Answer
Want to see the full answer?
Check out a sample textbook solution
Students have asked these similar questions
The average miles per gallon for a sample of 40 cars of model SX last year was 32.1, with a population standard deviation of 3.8. A sample of 40 cars from this year’s model SX has an average of 35.2 mpg, with a population standard deviation of 5.4.
Find a 99 percent confidence interval for the difference in average mpg for this car brand (this year’s model minus last year’s).Find a 99 percent confidence interval for the difference in average mpg for last year’s model minus this year’s. What does the negative difference mean?
A special interest group reports a tiny margin of error (plus or minus 0.04 percent) for its online survey based on 50,000 responses. Is the margin of error legitimate? (Assume that the group’s math is correct.)
Suppose that 73 percent of a sample of 1,000 U.S. college students drive a used car as opposed to a new car or no car at all.
Find an 80 percent confidence interval for the percentage of all U.S. college students who drive a used car.What sample size would cut this margin of error in half?
Chapter 10 Solutions
Pearson eText for An Introduction to Mathematical Statistics and Its Applications -- Instant Access (Pearson+)
Ch. 10.2 - The Advanced Placement Program allows high school...Ch. 10.2 - In Mendels classical experiments with peas, he...Ch. 10.2 - Prob. 3QCh. 10.2 - An army enlistment officer categorizes potential...Ch. 10.2 - A disgruntled Anchorage bush pilot, upset because...Ch. 10.2 - Based on his performance so far this season, a...Ch. 10.2 - Suppose that a random sample of fifty observations...Ch. 10.2 - Let the vector of random variables (X1,X2,X3) have...Ch. 10.2 - Prob. 9QCh. 10.2 - Prob. 10Q
Ch. 10.3 - Verify the following identity concerning the...Ch. 10.3 - One hundred unordered samples of size 2 are drawn...Ch. 10.3 - Prob. 3QCh. 10.3 - Show that the common belief in the propensity of...Ch. 10.3 - Prob. 5QCh. 10.3 - A number of reports in the medical literature...Ch. 10.3 - In a move that shocked candy traditionalists at...Ch. 10.3 - Test at the 0.10 level whether World Series...Ch. 10.3 - Records Kept at an eastern racetrack showed the...Ch. 10.3 - Prob. 10QCh. 10.3 - Prob. 11QCh. 10.3 - The man () and standard deviation () of pregnancy...Ch. 10.4 - A public policy polling group is investigating...Ch. 10.4 - From 1837 to 1932, the U.S. Supreme Court had...Ch. 10.4 - Prob. 3QCh. 10.4 - Carry out the details for goodness-of-fit test on...Ch. 10.4 - Prob. 5QCh. 10.4 - Do a goodness-of-fit test for normality on the SAT...Ch. 10.4 - A sociologist is studying various aspects of the...Ch. 10.4 - In theory, Monte Carlo studies rely on computers...Ch. 10.4 - Because it satisfies all the assumptions implicit...Ch. 10.4 - In American football a turnover is defined as a...Ch. 10.4 - Prob. 11QCh. 10.4 - To raise money for a new rectory, the members of a...Ch. 10.4 - Prob. 14QCh. 10.5 - While there are a number of diet and physical...Ch. 10.5 - Prob. 2QCh. 10.5 - A total of 1154 girls attending a public high...Ch. 10.5 - Recall the rubella/birth defect study described in...Ch. 10.5 - Research has suggested that regular use of aspirin...Ch. 10.5 - High blood pressure is known to be one of the...Ch. 10.5 - The following data were collected as part of a...Ch. 10.5 - A university conducted a study to assess...Ch. 10.5 - Some studies have suggested that pilots have an...Ch. 10.5 - Students elect to take Calculus I in different...
Knowledge Booster


Learn more about
Need a deep-dive on the concept behind this application? Look no further. Learn more about this topic, statistics and related others by exploring similar questions and additional content below.Similar questions
- You want to compare the average number of tines on the antlers of male deer in two nearby metro parks. A sample of 30 deer from the first park shows an average of 5 tines with a population standard deviation of 3. A sample of 35 deer from the second park shows an average of 6 tines with a population standard deviation of 3.2. Find a 95 percent confidence interval for the difference in average number of tines for all male deer in the two metro parks (second park minus first park).Do the parks’ deer populations differ in average size of deer antlers?arrow_forwardSuppose that you want to increase the confidence level of a particular confidence interval from 80 percent to 95 percent without changing the width of the confidence interval. Can you do it?arrow_forwardA random sample of 1,117 U.S. college students finds that 729 go home at least once each term. Find a 98 percent confidence interval for the proportion of all U.S. college students who go home at least once each term.arrow_forward
- Suppose that you make two confidence intervals with the same data set — one with a 95 percent confidence level and the other with a 99.7 percent confidence level. Which interval is wider?Is a wide confidence interval a good thing?arrow_forwardIs it true that a 95 percent confidence interval means you’re 95 percent confident that the sample statistic is in the interval?arrow_forwardTines can range from 2 to upwards of 50 or more on a male deer. You want to estimate the average number of tines on the antlers of male deer in a nearby metro park. A sample of 30 deer has an average of 5 tines, with a population standard deviation of 3. Find a 95 percent confidence interval for the average number of tines for all male deer in this metro park.Find a 98 percent confidence interval for the average number of tines for all male deer in this metro park.arrow_forward
- Based on a sample of 100 participants, the average weight loss the first month under a new (competing) weight-loss plan is 11.4 pounds with a population standard deviation of 5.1 pounds. The average weight loss for the first month for 100 people on the old (standard) weight-loss plan is 12.8 pounds, with population standard deviation of 4.8 pounds. Find a 90 percent confidence interval for the difference in weight loss for the two plans( old minus new) Whats the margin of error for your calculated confidence interval?arrow_forwardA 95 percent confidence interval for the average miles per gallon for all cars of a certain type is 32.1, plus or minus 1.8. The interval is based on a sample of 40 randomly selected cars. What units represent the margin of error?Suppose that you want to decrease the margin of error, but you want to keep 95 percent confidence. What should you do?arrow_forward3. (i) Below is the R code for performing a X2 test on a 2×3 matrix of categorical variables called TestMatrix: chisq.test(Test Matrix) (a) Assuming we have a significant result for this procedure, provide the R code (including any required packages) for an appropriate post hoc test. (b) If we were to apply this technique to a 2 × 2 case, how would we adapt the code in order to perform the correct test? (ii) What procedure can we use if we want to test for association when we have ordinal variables? What code do we use in R to do this? What package does this command belong to? (iii) The following code contains the initial steps for a scenario where we are looking to investigate the relationship between age and whether someone owns a car by using frequencies. There are two issues with the code - please state these. Row3<-c(75,15) Row4<-c(50,-10) MortgageMatrix<-matrix(c(Row1, Row4), byrow=T, nrow=2, MortgageMatrix dimnames=list(c("Yes", "No"), c("40 or older","<40")))…arrow_forward
- Describe the situation in which Fisher’s exact test would be used?(ii) When do we use Yates’ continuity correction (with respect to contingencytables)?[2 Marks] 2. Investigate, checking the relevant assumptions, whether there is an associationbetween age group and home ownership based on the sample dataset for atown below:Home Owner: Yes NoUnder 40 39 12140 and over 181 59Calculate and evaluate the effect size.arrow_forwardNot use ai pleasearrow_forwardNeed help with the following statistic problems.arrow_forward
arrow_back_ios
SEE MORE QUESTIONS
arrow_forward_ios
Recommended textbooks for you
 Holt Mcdougal Larson Pre-algebra: Student Edition...AlgebraISBN:9780547587776Author:HOLT MCDOUGALPublisher:HOLT MCDOUGAL
 Algebra and Trigonometry (MindTap Course List)AlgebraISBN:9781305071742Author:James Stewart, Lothar Redlin, Saleem WatsonPublisher:Cengage Learning
 College AlgebraAlgebraISBN:9781305115545Author:James Stewart, Lothar Redlin, Saleem WatsonPublisher:Cengage Learning
Holt Mcdougal Larson Pre-algebra: Student Edition...
Algebra
ISBN:9780547587776
Author:HOLT MCDOUGAL
Publisher:HOLT MCDOUGAL
Algebra and Trigonometry (MindTap Course List)
Algebra
ISBN:9781305071742
Author:James Stewart, Lothar Redlin, Saleem Watson
Publisher:Cengage Learning
College Algebra
Algebra
ISBN:9781305115545
Author:James Stewart, Lothar Redlin, Saleem Watson
Publisher:Cengage Learning
Mod-01 Lec-01 Discrete probability distributions (Part 1); Author: nptelhrd;https://www.youtube.com/watch?v=6x1pL9Yov1k;License: Standard YouTube License, CC-BY
Discrete Probability Distributions; Author: Learn Something;https://www.youtube.com/watch?v=m9U4UelWLFs;License: Standard YouTube License, CC-BY
Probability Distribution Functions (PMF, PDF, CDF); Author: zedstatistics;https://www.youtube.com/watch?v=YXLVjCKVP7U;License: Standard YouTube License, CC-BY
Discrete Distributions: Binomial, Poisson and Hypergeometric | Statistics for Data Science; Author: Dr. Bharatendra Rai;https://www.youtube.com/watch?v=lHhyy4JMigg;License: Standard Youtube License