
A Problem Solving Approach To Mathematics For Elementary School Teachers, Loose Leaf Edition Plus Mylab Math With Pearson Etext -- 18 Week Access Card Package (13th Edition)
13th Edition
ISBN: 9780136209409
Author: Rick Billstein, Shlomo Libeskind, Johnny Lott, Barbara Boschmans
Publisher: PEARSON
expand_more
expand_more
format_list_bulleted
Concept explainers
Videos
Textbook Question
Chapter 10.2, Problem 12MC
Mathematical Connections
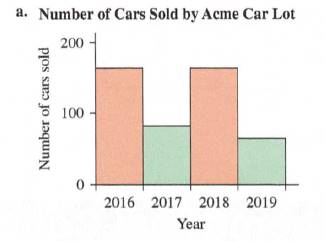
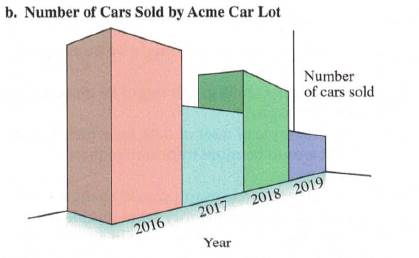
A histogram of the data for the number of cars sold by Acme Car Lot is given in (a) below. A three-dimensional version of the histogram as shown in (b) was given out by the company. What is wrong or misleading about the graph in (b)?
Expert Solution & Answer
Want to see the full answer?
Check out a sample textbook solution
Students have asked these similar questions
find
ж
185
х?
32
O să vă imaginea și date compune o problemă 42 31 1 0 9
Find the largest interval centered about x = 0 for which the given initial value problem has a unique solution.
y" + (tan x)y = ex, y(0) = 1, y'(0) = 0
Chapter 10 Solutions
A Problem Solving Approach To Mathematics For Elementary School Teachers, Loose Leaf Edition Plus Mylab Math With Pearson Etext -- 18 Week Access Card Package (13th Edition)
Ch. 10.1 - Suggest how students at different grades might...Ch. 10.1 - Mathematical Connections What are the Nielsen...Ch. 10.1 - Prob. 4MCCh. 10.1 - Read about basic ideas of statistics in Common...Ch. 10.1 - National Assessment of Educational ProgressNAEP...Ch. 10.1 - Prob. 2NAEPCh. 10.1 - Prob. 3NAEPCh. 10.1A - If one wanted to study the effect of using a...Ch. 10.1A - Prob. 2ACh. 10.1A - Prob. 3A
Ch. 10.1A - Prob. 4ACh. 10.1A - Prob. 5ACh. 10.1A - Prob. 6ACh. 10.1A - A second-grade class has a project to determine...Ch. 10.1A - Prob. 8ACh. 10.1A - Prob. 9ACh. 10.1A - Decide whether each of the following questions is...Ch. 10.1A - Prob. 11ACh. 10.1A - If a class were to investigate how many countries...Ch. 10.1A - Prob. 13ACh. 10.1A - In a set of student evaluations of their...Ch. 10.1A - If a bar graph like the one shown here were used...Ch. 10.1A - Prob. 16ACh. 10.1B - Assessment To study the effect of student...Ch. 10.1B - Assessment If students are measuring a tablespoon...Ch. 10.1B - Assessment If third graders were measuring an...Ch. 10.1B - Assessment To determine student computer use,...Ch. 10.1B - Suppose a poll is to be conducted in an elementary...Ch. 10.1B - Determine the population and the sample in the...Ch. 10.1B - A second-grade class has a project to determine...Ch. 10.1B - An elementary school class decides to determine...Ch. 10.1B - Prob. 12ACh. 10.1B - Prob. 13ACh. 10.1B - Assessment A university professor used a rating...Ch. 10.1B - Prob. 15ACh. 10.2 - Mathematical Connections a. Discuss when a...Ch. 10.2 - Mathematical Connections Explain whether a circle...Ch. 10.2 - Mathematical Connections Explain why the sum of...Ch. 10.2 - Mathematical Connections The federal budget for...Ch. 10.2 - Mathematical Connections Tell whether it is...Ch. 10.2 - Mathematical Connections Car sales from 1990 to...Ch. 10.2 - Mathematical Connections Find five examples of...Ch. 10.2 - Mathematical Connections A graph similar to the...Ch. 10.2 - Mathematical Connections Vale asks whether a stem...Ch. 10.2 - Mathematical Connections A histogram of the data...Ch. 10.2 - Mathematical Connections Paul asks how to create a...Ch. 10.2 - Mathematical Connections On the School Book Page...Ch. 10.2 - Prob. 15MCCh. 10.2 - Answer the Try It on the School Book Page on page...Ch. 10.2 - Answer the Try It on the School Book Page on page...Ch. 10.2 - National Assessment of Educational Progress NAEP...Ch. 10.2 - National Assessment of Educational Progress NAEP...Ch. 10.2 - National Assessment of Educational Progress NAEP...Ch. 10.2 - National Assessment of Educational Progress NAEP...Ch. 10.2 - National Assessment of Educational Progress NAEP...Ch. 10.2A - The following the pictograph shows the approximate...Ch. 10.2A - Prob. 2ACh. 10.2A - Prob. 3ACh. 10.2A - Sixth grade students reported the numbers of apps...Ch. 10.2A - Prob. 5ACh. 10.2A - Prob. 6ACh. 10.2A - Prob. 7ACh. 10.2A - Prob. 8ACh. 10.2A - Prob. 9ACh. 10.2A - Prob. 10ACh. 10.2A - Prob. 11ACh. 10.2A - Prob. 12ACh. 10.2A - Prob. 13ACh. 10.2A - a. A 2-inch-long rectangle serves as a percentage...Ch. 10.2A - Seniors Sierra High were asked to about their...Ch. 10.2A - Prob. 16ACh. 10.2A - Prob. 17ACh. 10.2A - Prob. 18ACh. 10.2B - The following pictograph shows the approximate...Ch. 10.2B - Display the following information about the status...Ch. 10.2B - In the figure shown, monthly sales of three...Ch. 10.2B - Prob. 4ACh. 10.2B - A list of presidents, with the number of children...Ch. 10.2B - Prob. 6ACh. 10.2B - The heights reached by 15 model rockets launched...Ch. 10.2B - Prob. 8ACh. 10.2B - Given the following bar graph, estimate the length...Ch. 10.2B - Prob. 10ACh. 10.2B - Prob. 11ACh. 10.2B - The graph below shows the number of books read by...Ch. 10.2B - Prob. 13ACh. 10.2B - Use the circle graph to answer the following...Ch. 10.2B - a. In a circle graph, a sector containing 82...Ch. 10.2B - A percentage bar graph with 100 is drawn to depict...Ch. 10.2B - Prob. 17ACh. 10.2B - Prob. 18ACh. 10.3 - Explain the concept of association as it is...Ch. 10.3 - Jacquie argued that scatterplots had little value...Ch. 10.3 - Prob. 6MCCh. 10.3 - The Garcia family drew a circle graph of their...Ch. 10.3 - Prob. 9MCCh. 10.3 - Prob. 10MCCh. 10.3 - A teacher surveyed 8 students in a class to find...Ch. 10.3 - Prob. 2NAEPCh. 10.3A - Assessment The graph below shows the population of...Ch. 10.3A - Assessment The graph shows the number of snow...Ch. 10.3A - Assessment The graph shows the US rates of adult...Ch. 10.3A - Prob. 5ACh. 10.3A - Prob. 6ACh. 10.3A - Prob. 7ACh. 10.3A - Assessment Consider an arithmetic sequence with...Ch. 10.3A - Prob. 9ACh. 10.3A - Assessment In the following scatterplots, find an...Ch. 10.3A - Assessment The following data show the amount of...Ch. 10.3A - Assessment If a trend line has equation...Ch. 10.3A - Assessment If a trend line has equation y=150.8x,...Ch. 10.3A - Assessment For each of the following pairs of...Ch. 10.3B - Prob. 1ACh. 10.3B - Prob. 2ACh. 10.3B - Prob. 3ACh. 10.3B - Prob. 4ACh. 10.3B - Prob. 5ACh. 10.3B - Prob. 6ACh. 10.3B - Prob. 7ACh. 10.3B - Prob. 8ACh. 10.3B - Prob. 9ACh. 10.3B - Prob. 10ACh. 10.3B - Prob. 11ACh. 10.3B - Prob. 12ACh. 10.3B - Prob. 13ACh. 10.3B - Assessment If a trend line has equation...Ch. 10.3B - Assessment For each of the following pairs of...Ch. 10.4 - Mathematical Connections Karl had scores of...Ch. 10.4 - The mean of the five numbers given is 50: 20 35 50...Ch. 10.4 - Prob. 6MCCh. 10.4 - Mathematical Connections Explain why the mode...Ch. 10.4 - Prob. 8MCCh. 10.4 - Mathematical Connections The mean of 5,7,9 is 7....Ch. 10.4 - Mathematical Connections If each number in a set...Ch. 10.4 - Mathematical Connections What does a large...Ch. 10.4 - Mathematical Connections In each pair of variables...Ch. 10.4 - Mathematical Connections Use the data in the...Ch. 10.4 - Mathematical Connections A student asks, If the...Ch. 10.4 - Mathematical Connections Jose asks, Why can a...Ch. 10.4 - Mathematical Connections Suppose the class takes a...Ch. 10.4 - Mathematical Connections A student asks if it is...Ch. 10.4 - Prob. 19MCCh. 10.4 - Mathematical Connections A student asks if it is...Ch. 10.4 - Mathematical Connections Mels mean on 10 tests for...Ch. 10.4 - Mathematical Connections On the School Book Page,...Ch. 10.4 - Prob. 25MCCh. 10.4 - Mathematical Connections Given the bar graph...Ch. 10.4 - Mathematical Connections Refer to the following...Ch. 10.4 - Mathematical Connections Following are raw test...Ch. 10.4 - Josephs current test scores, in points, are 83,...Ch. 10.4 - National Assessment of Educational Progress NAEP...Ch. 10.4 - Prob. 3NAEPCh. 10.4 - Richard wants to estimate the average mean monthly...Ch. 10.4A - Assessment Calculate the mean, the median, and the...Ch. 10.4A - Prob. 2ACh. 10.4A - Assessment a. If three students scored 75 on a...Ch. 10.4A - Prob. 4ACh. 10.4A - Assessment Suppose in Selinas class there were...Ch. 10.4A - Prob. 6ACh. 10.4A - Prob. 7ACh. 10.4A - Prob. 8ACh. 10.4A - Prob. 9ACh. 10.4A - Prob. 10ACh. 10.4A - Prob. 11ACh. 10.4A - Assessment The city of Podunk advertised itself as...Ch. 10.4A - Prob. 13ACh. 10.4A - Prob. 14ACh. 10.4A - Prob. 15ACh. 10.4A - Assessment Following are box plots comparing the...Ch. 10.4A - Prob. 17ACh. 10.4A - Assessment The following table shows the heights...Ch. 10.4A - Assessment What is the standard deviation of the...Ch. 10.4A - Prob. 20ACh. 10.4A - Prob. 21ACh. 10.4A - Assessment The average phone call in a certain...Ch. 10.4A - Prob. 23ACh. 10.4A - Prob. 24ACh. 10.4A - Prob. 25ACh. 10.4A - Prob. 26ACh. 10.4A - Prob. 27ACh. 10.4A - Prob. 28ACh. 10.4B - Calculate the mean, the median, and the mode for...Ch. 10.4B - Prob. 2ACh. 10.4B - Prob. 3ACh. 10.4B - Prob. 4ACh. 10.4B - Prob. 5ACh. 10.4B - Prob. 6ACh. 10.4B - Prob. 7ACh. 10.4B - Prob. 9ACh. 10.4B - Prob. 10ACh. 10.4B - Prob. 11ACh. 10.4B - Prob. 12ACh. 10.4B - Prob. 13ACh. 10.4B - Prob. 14ACh. 10.4B - Ginnys median score on three tests was 90. Her...Ch. 10.4B - Prob. 16ACh. 10.4B - Prob. 17ACh. 10.4B - The following table shows the heights in feet of...Ch. 10.4B - a. If all the numbers in a set are equal, what is...Ch. 10.4B - In a school system, teachers start at a salary of...Ch. 10.4B - Prob. 21ACh. 10.4B - Prob. 22ACh. 10.4B - Prob. 23ACh. 10.4B - Prob. 24ACh. 10.4B - The weights of newborn babies in a certain country...Ch. 10.4B - Prob. 26ACh. 10.4B - Prob. 27ACh. 10.4B - Prob. 28ACh. 10.4B - Prob. 29ACh. 10.CR - Suppose you read that the average family in...Ch. 10.CR - Prob. 2CRCh. 10.CR - Prob. 3CRCh. 10.CR - Prob. 5CRCh. 10.CR - Prob. 6CRCh. 10.CR - The budget for the Wegetem Crime Co. is 2,000,000....Ch. 10.CR - Prob. 8CRCh. 10.CR - Prob. 9CRCh. 10.CR - Prob. 11CRCh. 10.CR - Prob. 12CRCh. 10.CR - Prob. 13CRCh. 10.CR - Prob. 14CRCh. 10.CR - CHAPTER 10 REVIEW The following chart lists the...Ch. 10.CR - Prob. 16CRCh. 10.CR - Prob. 17CRCh. 10.CR - Prob. 19CRCh. 10.CR - Prob. 20CRCh. 10.CR - Prob. 21CRCh. 10.CR - Prob. 22CRCh. 10.CR - Prob. 24CRCh. 10.CR - CHAPTER 10 REVIEW Following are the record...Ch. 10.CR - Prob. 26CRCh. 10.CR - Prob. 27CRCh. 10.CR - Prob. 28CRCh. 10.CR - Prob. 29CRCh. 10.CR - Prob. 30CRCh. 10.CR - Prob. 32CRCh. 10.CR - CHAPTER 10 REVIEW Give examples of several ways to...Ch. 10.CR - Prob. 34CRCh. 10.CR - Prob. 35CRCh. 10.CR - Prob. 36CRCh. 10.CR - Prob. 37CRCh. 10 - Prob. 1NTCh. 10 - Prob. 2NTCh. 10 - Prob. 4NTCh. 10 - Prob. 5NTCh. 10 - Prob. 6NTCh. 10 - Prob. 7NTCh. 10 - Prob. 8NT
Knowledge Booster


Learn more about
Need a deep-dive on the concept behind this application? Look no further. Learn more about this topic, subject and related others by exploring similar questions and additional content below.Similar questions
- The table below shows the acreage, number of visitors, and total revenue of state parks and recreational areas in Massachusetts, New York, and Vermont in 2010. State Acreage (in thousands) Visitors (in thousands) Revenue (in thousands) Massachusetts 350 35,271 $12,644 New York 1,354 56,322 $85,558 Vermont 69 758 $10,969 Select the three true statements based on the data in the table. A. Vermont had the highest revenue per acre of state parks and recreational areas. B. Vermont had approximately 11 visitors per acre of state parks and recreational areas. C. New York had the highest number of visitors per acre of state parks and recreational areas. D. Massachusetts had approximately 36 visitors per acre of state parks and recreational areas. E. New York had revenue of approximately $63.19 per acre of state parks and recreational areas. F. Massachusetts had revenue of approximately $0.03 per acre of state parks and recreational areas.arrow_forwardMATLAB. Awnser the * parts in the commentsarrow_forwardMatlab. Awnser the * questions in the comments of the code.arrow_forward
- Prove by mathematical induction that for any positive integer n, the sum of the cubes of the first n natural numbers is given by: n Σκ k=1 (n(n + 1))²arrow_forward1 L'Ina (ln x) 2020 dx 0arrow_forwardCalibri BIUAAAA ויו Text in Italian is not being checked. Do you want to add it as a proofing language? Task 12 Fig 1 75 75 75 Fig 2 Fig 3j Add Figures 1 to 3 each shows a top view and a front view of models. Make use of the lineated paper for isometric projection and take each block on the paper as being 10mm x 10mm. Use the indicated sizes and draw an isometric view of each of the three models Samsung Galaxy A04earrow_forward
- a) show that the empty set and sigletonset are convex set. 6) show that every sub space of linear space X is convex but the convers heed not be true. c) let Mand N be two convex set of a linear Space X and KEF Show that MUN is conevex and (ii) M-N is convex or hot A and is MSN or NSM show that MUN convex or not, 385arrow_forwardxp x+xarrow_forwardFor the given graph, determine the following. -3 12 УА 4 3 - -1 ° 1 2 3 x -1. -2- a. Determine for which values of a the lim f (x) exists but f is not continuous at x = a. a b. Determine for which values of a the function is continuous but not differentiable at x = a. aarrow_forward
arrow_back_ios
SEE MORE QUESTIONS
arrow_forward_ios
Recommended textbooks for you
 Glencoe Algebra 1, Student Edition, 9780079039897...AlgebraISBN:9780079039897Author:CarterPublisher:McGraw Hill
 Big Ideas Math A Bridge To Success Algebra 1: Stu...AlgebraISBN:9781680331141Author:HOUGHTON MIFFLIN HARCOURTPublisher:Houghton Mifflin Harcourt
 Holt Mcdougal Larson Pre-algebra: Student Edition...AlgebraISBN:9780547587776Author:HOLT MCDOUGALPublisher:HOLT MCDOUGAL
 Trigonometry (MindTap Course List)TrigonometryISBN:9781337278461Author:Ron LarsonPublisher:Cengage Learning
 Functions and Change: A Modeling Approach to Coll...AlgebraISBN:9781337111348Author:Bruce Crauder, Benny Evans, Alan NoellPublisher:Cengage Learning
Glencoe Algebra 1, Student Edition, 9780079039897...
Algebra
ISBN:9780079039897
Author:Carter
Publisher:McGraw Hill
Big Ideas Math A Bridge To Success Algebra 1: Stu...
Algebra
ISBN:9781680331141
Author:HOUGHTON MIFFLIN HARCOURT
Publisher:Houghton Mifflin Harcourt
Holt Mcdougal Larson Pre-algebra: Student Edition...
Algebra
ISBN:9780547587776
Author:HOLT MCDOUGAL
Publisher:HOLT MCDOUGAL
Trigonometry (MindTap Course List)
Trigonometry
ISBN:9781337278461
Author:Ron Larson
Publisher:Cengage Learning
Functions and Change: A Modeling Approach to Coll...
Algebra
ISBN:9781337111348
Author:Bruce Crauder, Benny Evans, Alan Noell
Publisher:Cengage Learning
Which is the best chart: Selecting among 14 types of charts Part II; Author: 365 Data Science;https://www.youtube.com/watch?v=qGaIB-bRn-A;License: Standard YouTube License, CC-BY