
Essentials of Statistics; MathXL Valuepack Access Card (6-months) (5th Edition)
5th Edition
ISBN: 9780133954982
Author: Mario F. Triola
Publisher: PEARSON
expand_more
expand_more
format_list_bulleted
Concept explainers
Videos
Textbook Question
Chapter 10.2, Problem 12BSC
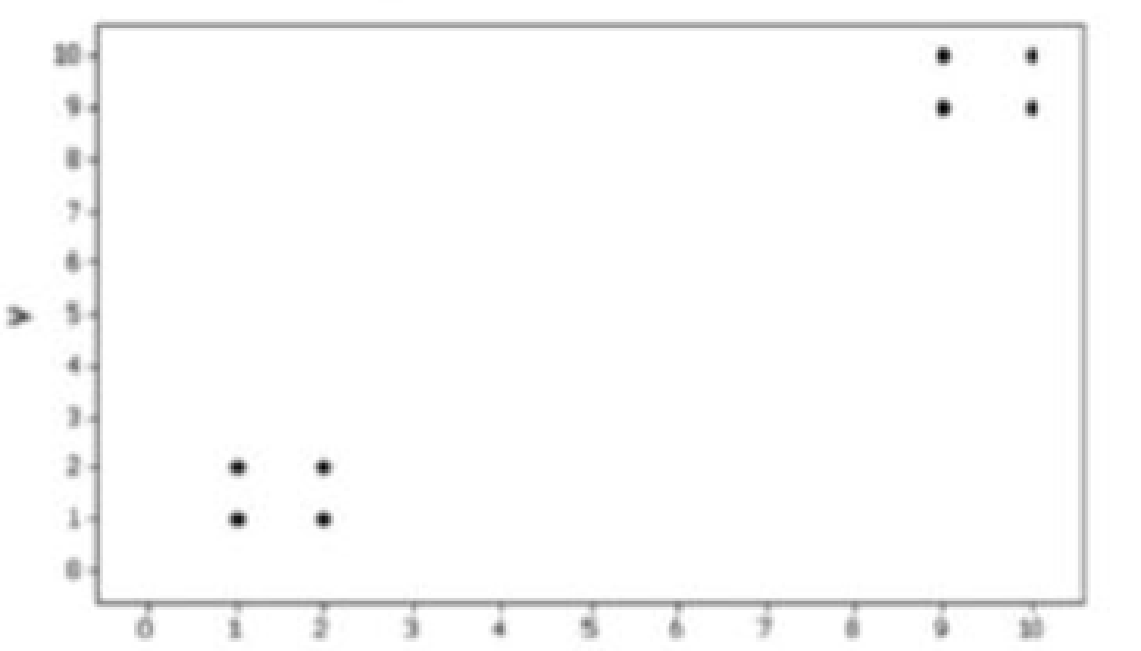
Clusters Refer to the following Minitab-generated
- a. Examine the pattern of the four points in the lower left comer (from women) only, and subjectively determine whether there appears to be a
correlation between x and y for women. - b. Examine the pattern of the four points in the upper right corner (from women) only, and subjectively determine whether there appears to be a correlation between x and y for men.
- c. Find the linear
correlation coefficient using only the four point- in the lower left coma (for women) Will the tour points in the upper left comer (for men) have the same linear correlation coefficient ? - d. Find the value of the linear correlation coefficient using all eight points. What does that value suggest about the relationship between x and y?
- e. Based on the preceding results, what do you conclude? Should the data from women and the data from men be considered together, or do they appear to represent two different and distinct populations that should be analyzed separately?
Expert Solution & Answer

Trending nowThis is a popular solution!

Students have asked these similar questions
Solve for X. Explain each step.
2^2x • 2^-4=8
One hundred people were surveyed, and one question pertained to their educational background. The results of this question and their genders are given in the following table.
Female (F)
Male (F′)
Total
College degree (D)
30
20
50
No college degree (D′)
30
20
50
Total
60
40
100
If a person is selected at random from those surveyed, find the probability of each of the following events.1. The person is female or has a college degree. Answer:
equation editor
Equation Editor
2. The person is male or does not have a college degree. Answer:
equation editor
Equation Editor
3. The person is female or does not have a college degree.
need help with part b
Chapter 10 Solutions
Essentials of Statistics; MathXL Valuepack Access Card (6-months) (5th Edition)
Ch. 10.2 - Notation For each of several randomly selected...Ch. 10.2 - Physics Experiment A physics experiment consists...Ch. 10.2 - Cause of High Blood Pressure Some studies have...Ch. 10.2 - Notation What is the difference between the...Ch. 10.2 - Interpreting r. In Exercises 5-8, use a...Ch. 10.2 - Interpreting r. In Exercises 5-8, use a...Ch. 10.2 - Interpreting r. In Exercises 5-8, use a...Ch. 10.2 - Cereal Killers The amounts of sugar (grams of...Ch. 10.2 - Explore! Exercises 9 and 10 provide two data sets...Ch. 10.2 - Explore! Exercises 9 and 10 provide two data sets...
Ch. 10.2 - Outlier Refer in the accompanying...Ch. 10.2 - Clusters Refer to the following Minitab-generated...Ch. 10.2 - Testing for a Linear Correlation. In Exercises...Ch. 10.2 - Prob. 14BSCCh. 10.2 - Testing for a Linear Correlation. In Exercises...Ch. 10.2 - Testing for a Linear Correlation. In Exercises...Ch. 10.2 - Testing for a Linear Correlation. In Exercises...Ch. 10.2 - Testing for a Linear Correlation. In Exercises...Ch. 10.2 - Prob. 19BSCCh. 10.2 - Prob. 20BSCCh. 10.2 - Testing for a Linear Correlation. In Exercises...Ch. 10.2 - Testing for a Linear Correlation. In Exercises...Ch. 10.2 - Prob. 23BSCCh. 10.2 - Prob. 24BSCCh. 10.2 - Testing for a Linear Correlation. In Exercises...Ch. 10.2 - Prob. 26BSCCh. 10.2 - Testing for a Linear Correlation. In Exercises...Ch. 10.2 - Testing for a Linear Correlation. In Exercises...Ch. 10.2 - Large Data Sets. In Exercises 29-32, use the data...Ch. 10.2 - Large Data Sets. In Exercises 29-32, use the data...Ch. 10.2 - Appendix B Data Sets. In Exercises 29-34, use the...Ch. 10.2 - Large Data Sets. In Exercises 29-32, use the data...Ch. 10.2 - Transformed Data In addition to testing for a...Ch. 10.2 - Prob. 34BBCh. 10.3 - Notation and Terminology If we use the paired...Ch. 10.3 - Best-Fit Line In what sense is the regression line...Ch. 10.3 - Prob. 3BSCCh. 10.3 - Notation What is the difference between the...Ch. 10.3 - Making Predictions. In Exercises 5-8, let the...Ch. 10.3 - Making Predictions. In Exercises 5-8, let the...Ch. 10.3 - Making Predictions. In Exercises 5-8, let the...Ch. 10.3 - Making Predictions. In Exercises 5-8, let the...Ch. 10.3 - Finding the Equation of the Regression Line. In...Ch. 10.3 - Finding the Equation of the Regression Line. In...Ch. 10.3 - Effects of an Outlier Refer to the Mini...Ch. 10.3 - Effects of Clusters Refer to the Minitab-generated...Ch. 10.3 - Regression and Predictions. Exercises 13-28 use...Ch. 10.3 - Regression and Predictions. Exercises 13-28 use...Ch. 10.3 - Regression and Predictions. Exercises 13-28 use...Ch. 10.3 - Regression and Predictions. Exercises 13-28 use...Ch. 10.3 - Regression and Predictions. Exercises 13-28 use...Ch. 10.3 - Regression and Predictions. Exercises 13-28 use...Ch. 10.3 - Regression and Predictions. Exercises 13-28 use...Ch. 10.3 - Regression and Predictions. Exercises 13-28 use...Ch. 10.3 - Regression and Predictions. Exercises 13-28 use...Ch. 10.3 - Regression and Predictions. Exercises 13-28 use...Ch. 10.3 - Regression and Predictions. Exercises 13-28 use...Ch. 10.3 - Regression and Predictions. Exercises 13-28 use...Ch. 10.3 - Regression and Predictions. Exercises 13-28 use...Ch. 10.3 - Regression and Predictions. Exercises 1328 use the...Ch. 10.3 - Regression and Predictions. Exercises 1328 use the...Ch. 10.3 - Regression and Predictions. Exercises 1328 use the...Ch. 10.3 - Large Data Sets. Exercises 2932 use the same...Ch. 10.3 - Large Data Sets. Exercises 2932 use the same...Ch. 10.3 - Prob. 31BSCCh. 10.3 - Large Data Sets. Exercises 29-32 use the same...Ch. 10.3 - Prob. 33BBCh. 10.3 - Prob. 34BBCh. 10.4 - Regression If the methods of this section arc used...Ch. 10.4 - Level of Measurement Which of the levels of...Ch. 10.4 - Prob. 3BSCCh. 10.4 - Prob. 4BSCCh. 10.4 - Prob. 5BSCCh. 10.4 - Prob. 6BSCCh. 10.4 - Prob. 7BSCCh. 10.4 - Testing for Rank Correlation. In Exercises 7-12,...Ch. 10.4 - Prob. 9BSCCh. 10.4 - Testing for Rank Correlation. In Exercises 7-12,...Ch. 10.4 - Prob. 11BSCCh. 10.4 - Prob. 12BSCCh. 10.4 - Appendix B Data Sets. In Exercises 13-16, use the...Ch. 10.4 - Prob. 14BSCCh. 10.4 - Appendix B Data Sets. In Exercises 13-16, use the...Ch. 10.4 - Prob. 16BSCCh. 10.4 - Prob. 17BBCh. 10 - The exercises arc based on the following sample...Ch. 10 - Prob. 2CQQCh. 10 - Prob. 3CQQCh. 10 - The exercises are based on the following sample...Ch. 10 - The exercises are based on the following sample...Ch. 10 - Prob. 6CQQCh. 10 - Prob. 7CQQCh. 10 - Prob. 8CQQCh. 10 - Prob. 9CQQCh. 10 - Prob. 10CQQCh. 10 - Old Faithful The table below lists measurements...Ch. 10 - Prob. 2RECh. 10 - Prob. 3RECh. 10 - Prob. 4RECh. 10 - Prob. 5RECh. 10 - Prob. 1CRECh. 10 - Prob. 2CRECh. 10 - Prob. 3CRECh. 10 - Prob. 4CRECh. 10 - Effectiveness of Diet. Listed below are weights...Ch. 10 - Prob. 6CRECh. 10 - Prob. 7CRECh. 10 - Effectiveness of Diet. Listed below are weights...Ch. 10 - Prob. 9CRECh. 10 - Prob. 10CRECh. 10 - Critical Thinking: Is replication validation? The...Ch. 10 - Prob. 2FDDCh. 10 - Prob. 3FDD
Knowledge Booster


Learn more about
Need a deep-dive on the concept behind this application? Look no further. Learn more about this topic, statistics and related others by exploring similar questions and additional content below.Similar questions
- Suppose you know that Bob's test score is above the mean, but he doesn't remember by how much. At least how many students must score lower than Bob?arrow_forwardIf a baby's weight is at the median, what's her percentile?arrow_forwardAt the same restaurant as in Question 19 with the same normal distribution, what's the chance of it taking no more than 15 minutes to get service?arrow_forward
- Clint, obviously not in college, sleeps an average of 8 hours per night with a standard deviation of 15 minutes. What's the chance of him sleeping between 7.5 and 8.5 hours on any given night? 0-(7-0) 200 91109s and doiw $20 (8-0) mol 8520 slang $199 galbrog seam side pide & D (newid se od poyesvig as PELEO PER AFTE editiw noudab temand van Czarrow_forwardTimes to complete a statistics exam have a normal distribution with a mean of 40 minutes and standard deviation of 6 minutes. Deshawn's time comes in at the 90th percentile. What percentage of the students are still working on their exams when Deshawn leaves?arrow_forwardSuppose that the weights of cereal boxes have a normal distribution with a mean of 20 ounces and standard deviation of half an ounce. A box that has a standard score of o weighs how much? syed by ilog ni 21arrow_forward
- Bob scores 80 on both his math exam (which has a mean of 70 and standard deviation of 10) and his English exam (which has a mean of 85 and standard deviation of 5). Find and interpret Bob's Z-scores on both exams to let him know which exam (if either) he did bet- ter on. Don't, however, let his parents know; let them think he's just as good at both subjects. algas 70) sering digarrow_forwardSue's math class exam has a mean of 70 with a standard deviation of 5. Her standard score is-2. What's her original exam score?arrow_forwardClint sleeps an average of 8 hours per night with a standard deviation of 15 minutes. What's the chance he will sleep less than 7.5 hours tonight? nut bow visarrow_forward
- Suppose that your score on an exam is directly at the mean. What's your standard score?arrow_forwardOne state's annual rainfall has a normal dis- tribution with a mean of 100 inches and standard deviation of 25 inches. Suppose that corn grows best when the annual rainfall is between 100 and 150 inches. What's the chance of achieving this amount of rainfall? wved now of sociarrow_forward13 Suppose that your exam score has a standard score of 0.90. Does this mean that 90 percent of the other exam scores are lower than yours?arrow_forward
arrow_back_ios
SEE MORE QUESTIONS
arrow_forward_ios
Recommended textbooks for you
 Glencoe Algebra 1, Student Edition, 9780079039897...AlgebraISBN:9780079039897Author:CarterPublisher:McGraw Hill
 Big Ideas Math A Bridge To Success Algebra 1: Stu...AlgebraISBN:9781680331141Author:HOUGHTON MIFFLIN HARCOURTPublisher:Houghton Mifflin Harcourt
 Holt Mcdougal Larson Pre-algebra: Student Edition...AlgebraISBN:9780547587776Author:HOLT MCDOUGALPublisher:HOLT MCDOUGAL
 Functions and Change: A Modeling Approach to Coll...AlgebraISBN:9781337111348Author:Bruce Crauder, Benny Evans, Alan NoellPublisher:Cengage Learning
Glencoe Algebra 1, Student Edition, 9780079039897...
Algebra
ISBN:9780079039897
Author:Carter
Publisher:McGraw Hill
Big Ideas Math A Bridge To Success Algebra 1: Stu...
Algebra
ISBN:9781680331141
Author:HOUGHTON MIFFLIN HARCOURT
Publisher:Houghton Mifflin Harcourt
Holt Mcdougal Larson Pre-algebra: Student Edition...
Algebra
ISBN:9780547587776
Author:HOLT MCDOUGAL
Publisher:HOLT MCDOUGAL
Functions and Change: A Modeling Approach to Coll...
Algebra
ISBN:9781337111348
Author:Bruce Crauder, Benny Evans, Alan Noell
Publisher:Cengage Learning
Correlation Vs Regression: Difference Between them with definition & Comparison Chart; Author: Key Differences;https://www.youtube.com/watch?v=Ou2QGSJVd0U;License: Standard YouTube License, CC-BY
Correlation and Regression: Concepts with Illustrative examples; Author: LEARN & APPLY : Lean and Six Sigma;https://www.youtube.com/watch?v=xTpHD5WLuoA;License: Standard YouTube License, CC-BY