
Concept explainers
Videos
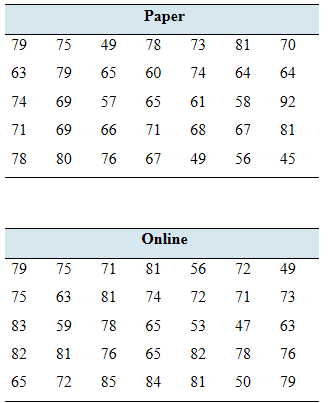
Online testing: Do you prefer taking tests on paper or online? A college instructor gave identical tests to two randomly sampled groups of 35 students. One group took the test on paper and the other took it online. Following are the test scores.
- Construct a 95% confidence interval for the difference in
mean scores between paper and online tests. - The instructor claims that the mean scores are the same for both the paper and the online versions of the test. Does the confidence Interval contradict this claim?
a.
To find: The
Answer to Problem 25E
The
Explanation of Solution
Given information:
The data is,
| Paper | ||||||
| 79 | 75 | 49 | 78 | 73 | 81 | 70 |
| 63 | 79 | 65 | 60 | 74 | 64 | 64 |
| 74 | 69 | 57 | 65 | 61 | 58 | 92 |
| 71 | 69 | 66 | 71 | 68 | 67 | 81 |
| 78 | 80 | 76 | 67 | 49 | 56 | 45 |
| Online | ||||||
| 79 | 75 | 71 | 81 | 56 | 72 | 49 |
| 75 | 63 | 81 | 74 | 72 | 71 | 73 |
| 83 | 59 | 78 | 65 | 53 | 47 | 63 |
| 82 | 81 | 76 | 65 | 82 | 78 | 76 |
| 65 | 72 | 85 | 84 | 81 | so | 79 |
Concept used:
Minitab is used.
Calculation:
The steps for the confidence interval are,
Import the data, select start and choose the basic statistics option then select the 2 sample t and enter summarized data.
Click option button choose confidence level, test difference and alternative hypothesis and then click ok.
The data is shown below.
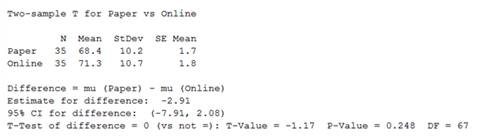
Figure-1
Therefore, the
b.
To find: Whether the confident interval contradict the claim.
Answer to Problem 25E
The confident interval does not contradict the claim
Explanation of Solution
Given information:
The data is,
| Paper | ||||||
| 79 | 75 | 49 | 78 | 73 | 81 | 70 |
| 63 | 79 | 65 | 60 | 74 | 64 | 64 |
| 74 | 69 | 57 | 65 | 61 | 58 | 92 |
| 71 | 69 | 66 | 71 | 68 | 67 | 81 |
| 78 | 80 | 76 | 67 | 49 | 56 | 45 |
| Online | ||||||
| 79 | 75 | 71 | 81 | 56 | 72 | 49 |
| 75 | 63 | 81 | 74 | 72 | 71 | 73 |
| 83 | 59 | 78 | 65 | 53 | 47 | 63 |
| 82 | 81 | 76 | 65 | 82 | 78 | 76 |
| 65 | 72 | 85 | 84 | 81 | so | 79 |
Concept used:
Minitab is used.
Calculation:
Since, the
Therefore, the confident interval does not contradict the claim.
Want to see more full solutions like this?
Chapter 10 Solutions
Elementary Statistics (Text Only)


- A retail store manager claims that the average daily sales of the store are $1,500. You aim to test whether the actual average daily sales differ significantly from this claimed value. You can provide your answer by inserting a text box and the answer must include: Null hypothesis, Alternative hypothesis, Show answer (output table/summary table), and Conclusion based on the P value. Showing the calculation is a must. If calculation is missing,so please provide a step by step on the answers Numerical answers in the yellow cellsarrow_forwardShow all workarrow_forwardShow all workarrow_forward
- please find the answers for the yellows boxes using the information and the picture belowarrow_forwardA marketing agency wants to determine whether different advertising platforms generate significantly different levels of customer engagement. The agency measures the average number of daily clicks on ads for three platforms: Social Media, Search Engines, and Email Campaigns. The agency collects data on daily clicks for each platform over a 10-day period and wants to test whether there is a statistically significant difference in the mean number of daily clicks among these platforms. Conduct ANOVA test. You can provide your answer by inserting a text box and the answer must include: also please provide a step by on getting the answers in excel Null hypothesis, Alternative hypothesis, Show answer (output table/summary table), and Conclusion based on the P value.arrow_forwardA company found that the daily sales revenue of its flagship product follows a normal distribution with a mean of $4500 and a standard deviation of $450. The company defines a "high-sales day" that is, any day with sales exceeding $4800. please provide a step by step on how to get the answers Q: What percentage of days can the company expect to have "high-sales days" or sales greater than $4800? Q: What is the sales revenue threshold for the bottom 10% of days? (please note that 10% refers to the probability/area under bell curve towards the lower tail of bell curve) Provide answers in the yellow cellsarrow_forward
 Glencoe Algebra 1, Student Edition, 9780079039897...AlgebraISBN:9780079039897Author:CarterPublisher:McGraw Hill
 Holt Mcdougal Larson Pre-algebra: Student Edition...AlgebraISBN:9780547587776Author:HOLT MCDOUGALPublisher:HOLT MCDOUGAL
 Big Ideas Math A Bridge To Success Algebra 1: Stu...AlgebraISBN:9781680331141Author:HOUGHTON MIFFLIN HARCOURTPublisher:Houghton Mifflin Harcourt
 College Algebra (MindTap Course List)AlgebraISBN:9781305652231Author:R. David Gustafson, Jeff HughesPublisher:Cengage Learning