
Concept explainers
Videos
Stopping Distances
In a study on speed control, it was found that the main reasons for regulations were to make traffic flow more efficient and to minimize the risk of danger. An area that was focused on in the study was the distance required to completely stop a vehicle at various speeds. Use the following table to answer the questions.
| MPH | Braking distance (feet) |
| 20 30 40 50 60 80 |
20 45 81 133 205 411 |
Assume MPH is going to be used to predict stopping distance.
1. Which of the two variables is the independent variable?
2. Which is the dependent variable?
3. What type of variable is the independent variable?
4. What type of variable is the dependent variable?
5. Construct a
6. Is there a linear relationship between the two variables?
7. Redraw the scatter plot, and change the distances between the independent-variable numbers. Does the relationship look different?
8. Is the relationship positive or negative?
9. Can braking distance be accurately predicted from MPH?
10.List some other variables that affect braking distance.
11. Compute the value of r.
12. Is r significant at α = 0.05?
1.
To identify: The independent variable.
Answer to Problem 1AC
The independent variable is MPH (miles per hour).
Explanation of Solution
Given info:
The table shows the MPH (miles per hour) and Braking distance in feet.
Calculation:
Independent variable:
If the variable does not dependent on the other variables then the variables are said to be independent variable.
Here, the variable “Miles per hour” does not depend on the other variables. Thus, the independent variable is MPH (miles per hour).
2.
To identify: The dependent variable.
Answer to Problem 1AC
The dependent variable is Braking distance (feet).
Explanation of Solution
Calculation:
Dependent variable:
If the variable depends on the other variables then the variable is said to be dependent variable.
Here, the variable “Braking distance” depends on the other variables. That is the variable braking distance depends on the MPH (miles per hour). Thus, the dependent variable is Braking distance (feet).
3.
The type of variable is the independent variable.
Answer to Problem 1AC
The type of independent variable is the continuous quantitative variable.
Explanation of Solution
Justification:
Continuous quantitative variable:
If the variable takes values on interval scale then the variable is said to be continuous quantitative variable. In the continuous variable, the infinitely many number of values can be considered.
Here, the independent variable miles per hour (MPH) can take any value from a wide range of values. Thus, the independent variable miles per hour (MPH) is continuous quantitative variable.
4.
The type of variable is the dependent variable.
Answer to Problem 1AC
The type of dependent variable is the continuous quantitative variable.
Explanation of Solution
Justification:
Here, the dependent variable braking distance (feet) can take any value from a wide range of values. Thus, the independent variable braking distance (feet) is continuous quantitative variable.
5.
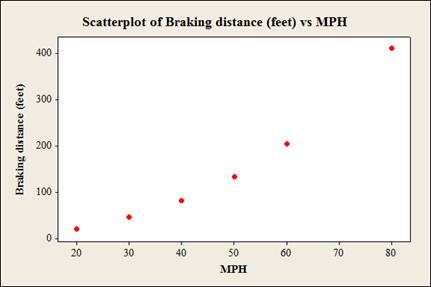
To construct: The scatterplot for the data.
Answer to Problem 1AC
The scatterplot for the data given data using Minitab software is:
Explanation of Solution
Calculation:
The data shows the MPH (miles per hour) and Braking distance (feet) for vehicles.
Step by step procedure to obtain scatterplot using the MINITAB software:
- Choose Graph > Scatterplot.
- Choose Simple and then click OK.
- Under Y variables, enter a column of Braking distance (feet).
- Under X variables, enter a column of MPH.
- Click OK.
6.
To check: Whether there is a linear relationship between the two variables.
Answer to Problem 1AC
Yes, there is a linear relationship between the two variables.
Explanation of Solution
Justification:
The horizontal axis represents miles per hour (MPH) and vertical axis represents braking distance (feet).
From the plot, it is observed that there is a linear relationship between the variables miles per hour (MPH) and braking distance (feet) because the data points show a distinct pattern.
7.
To construct: The scatterplot for the changed data.
To check: Whether the relationship looks different or not.
Answer to Problem 1AC
The scatterplot for the changed data by using Minitab software is:
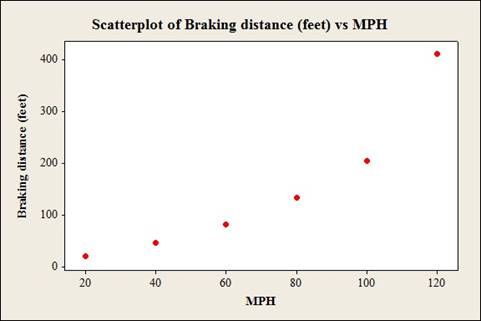
The increments will change the appearance of the relationship if changing the distance between the independent-variable (mph).
Explanation of Solution
Calculation:
The data shows the MPH (miles per hour) and Braking distance (feet) for vehicles.
After changing the distance between the independent-variable numbers, the number of the independent-variable is, 20, 40, 60, 80, 100 and 120.
Step by step procedure to obtain scatterplot using the MINITAB software:
- Choose Graph > Scatterplot.
- Choose Simple and then click OK.
- Under Y variables, enter a column of Braking distance (feet).
- Under X variables, enter a column of MPH.
- Click OK.
Justification:
From the graphs it can be observed that, after changing the distance between the independent-variable (mph), the increments will change the appearance of the relationship.
8.
To check: Whether the relationship is positive or negative.
Answer to Problem 1AC
The relationship is positive.
Explanation of Solution
Justification:
The relationship is positive because the values of independent variable increases then the values of corresponding dependent variable are increases.
9.
To check: Whether the braking distance can be accurately predicted from MPH.
Answer to Problem 1AC
Yes, the braking distance can be accurately predicted from MPH.
Explanation of Solution
Justification:
Here, the braking distance can be accurately predicted from MPH because the relationship between two variables MPH and Breaking distance is strong.
10.
To list: The other variables that affect braking distance.
Answer to Problem 1AC
The other variables that affect braking distance are road conditions, driver response time and condition of the brakes.
Explanation of Solution
Justification:
Answer may wary. One of the possible answers is as follows.
The variable affecting the braking distance are road conditions, driver response time and condition of the brakes.
11.
To compute: The value of r.
Answer to Problem 1AC
The value of r is 0.966.
Explanation of Solution
Calculation:
Correlation coefficient r:
Software Procedure:
Step-by-step procedure to obtain the ‘correlation coefficient’ using the MINITAB software:
- Select Stat > Basic Statistics > Correlation.
- In Variables, select MPH and Braking distance (feet) from the box on the left.
- Click OK.
Output using the MINITAB software is given below:
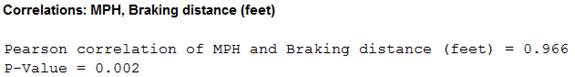
Thus, the Pearson correlation of MPH and Braking distance is 0.966.
12.
To check: Whether or not the r value is significant at 0.05.
Answer to Problem 1AC
Yes, the r value is significant at 0.05.
Explanation of Solution
Calculation:
Here, the r value is significant is checked. So, the claim is that the r value is significant.
The hypotheses are given below:
Null hypothesis:
That is, there is no linear relation between the MPH and Braking distance.
Alternative hypothesis:
That is, there is linear relation between the MPH and Braking distance.
The sample size is 6.
The formula to find the degrees of the freedom is
That is,
From the “TABLE –I: Critical Values for the PPMC”, the critical value for 4 degrees of freedom and
Rejection Rule:
If the absolute value of r is greater than the critical value then reject the null hypothesis.
Conclusion:
From part (11), the Pearson correlation of MPH and Braking distance is 0.966. That is the absolute value of r is 0.966.
Here,
By the rejection rule, reject the null hypothesis.
There is sufficient evidence to support the claim that “there is a linear relation between the MPH and Braking distance”.
Want to see more full solutions like this?
Chapter 10 Solutions
ALEKS 360 ELEM STATISTICS
Additional Math Textbook Solutions
Introductory Statistics
Elementary & Intermediate Algebra
A First Course in Probability (10th Edition)
Calculus: Early Transcendentals (2nd Edition)
Elementary Statistics: Picturing the World (7th Edition)
Basic College Mathematics


- Please answer the questionsarrow_forward30. An individual who has automobile insurance from a certain company is randomly selected. Let Y be the num- ber of moving violations for which the individual was cited during the last 3 years. The pmf of Y isy | 1 2 4 8 16p(y) | .05 .10 .35 .40 .10 a.Compute E(Y).b. Suppose an individual with Y violations incurs a surcharge of $100Y^2. Calculate the expected amount of the surcharge.arrow_forward24. An insurance company offers its policyholders a num- ber of different premium payment options. For a ran- domly selected policyholder, let X = the number of months between successive payments. The cdf of X is as follows: F(x)=0.00 : x < 10.30 : 1≤x<30.40 : 3≤ x < 40.45 : 4≤ x <60.60 : 6≤ x < 121.00 : 12≤ x a. What is the pmf of X?b. Using just the cdf, compute P(3≤ X ≤6) and P(4≤ X).arrow_forward
- 59. At a certain gas station, 40% of the customers use regular gas (A1), 35% use plus gas (A2), and 25% use premium (A3). Of those customers using regular gas, only 30% fill their tanks (event B). Of those customers using plus, 60% fill their tanks, whereas of those using premium, 50% fill their tanks.a. What is the probability that the next customer will request plus gas and fill the tank (A2 B)?b. What is the probability that the next customer fills the tank?c. If the next customer fills the tank, what is the probability that regular gas is requested? Plus? Premium?arrow_forward38. Possible values of X, the number of components in a system submitted for repair that must be replaced, are 1, 2, 3, and 4 with corresponding probabilities .15, .35, .35, and .15, respectively. a. Calculate E(X) and then E(5 - X).b. Would the repair facility be better off charging a flat fee of $75 or else the amount $[150/(5 - X)]? [Note: It is not generally true that E(c/Y) = c/E(Y).]arrow_forward74. The proportions of blood phenotypes in the U.S. popula- tion are as follows:A B AB O .40 .11 .04 .45 Assuming that the phenotypes of two randomly selected individuals are independent of one another, what is the probability that both phenotypes are O? What is the probability that the phenotypes of two randomly selected individuals match?arrow_forward
- 53. A certain shop repairs both audio and video compo- nents. Let A denote the event that the next component brought in for repair is an audio component, and let B be the event that the next component is a compact disc player (so the event B is contained in A). Suppose that P(A) = .6 and P(B) = .05. What is P(BA)?arrow_forward26. A certain system can experience three different types of defects. Let A;(i = 1,2,3) denote the event that the sys- tem has a defect of type i. Suppose thatP(A1) = .12 P(A) = .07 P(A) = .05P(A, U A2) = .13P(A, U A3) = .14P(A2 U A3) = .10P(A, A2 A3) = .011Rshelfa. What is the probability that the system does not havea type 1 defect?b. What is the probability that the system has both type 1 and type 2 defects?c. What is the probability that the system has both type 1 and type 2 defects but not a type 3 defect? d. What is the probability that the system has at most two of these defects?arrow_forwardThe following are suggested designs for group sequential studies. Using PROCSEQDESIGN, provide the following for the design O’Brien Fleming and Pocock.• The critical boundary values for each analysis of the data• The expected sample sizes at each interim analysisAssume the standardized Z score method for calculating boundaries.Investigators are evaluating the success rate of a novel drug for treating a certain type ofbacterial wound infection. Since no existing treatment exists, they have planned a one-armstudy. They wish to test whether the success rate of the drug is better than 50%, whichthey have defined as the null success rate. Preliminary testing has estimated the successrate of the drug at 55%. The investigators are eager to get the drug into production andwould like to plan for 9 interim analyses (10 analyzes in total) of the data. Assume thesignificance level is 5% and power is 90%.Besides, draw a combined boundary plot (OBF, POC, and HP)arrow_forward
- Please provide the solution for the attached image in detailed.arrow_forward20 km, because GISS Worksheet 10 Jesse runs a small business selling and delivering mealie meal to the spaza shops. He charges a fixed rate of R80, 00 for delivery and then R15, 50 for each packet of mealle meal he delivers. The table below helps him to calculate what to charge his customers. 10 20 30 40 50 Packets of mealie meal (m) Total costs in Rands 80 235 390 545 700 855 (c) 10.1. Define the following terms: 10.1.1. Independent Variables 10.1.2. Dependent Variables 10.2. 10.3. 10.4. 10.5. Determine the independent and dependent variables. Are the variables in this scenario discrete or continuous values? Explain What shape do you expect the graph to be? Why? Draw a graph on the graph provided to represent the information in the table above. TOTAL COST OF PACKETS OF MEALIE MEAL 900 800 700 600 COST (R) 500 400 300 200 100 0 10 20 30 40 60 NUMBER OF PACKETS OF MEALIE MEALarrow_forwardLet X be a random variable with support SX = {−3, 0.5, 3, −2.5, 3.5}. Part ofits probability mass function (PMF) is given bypX(−3) = 0.15, pX(−2.5) = 0.3, pX(3) = 0.2, pX(3.5) = 0.15.(a) Find pX(0.5).(b) Find the cumulative distribution function (CDF), FX(x), of X.1(c) Sketch the graph of FX(x).arrow_forward
 Glencoe Algebra 1, Student Edition, 9780079039897...AlgebraISBN:9780079039897Author:CarterPublisher:McGraw Hill
 Functions and Change: A Modeling Approach to Coll...AlgebraISBN:9781337111348Author:Bruce Crauder, Benny Evans, Alan NoellPublisher:Cengage Learning
 Big Ideas Math A Bridge To Success Algebra 1: Stu...AlgebraISBN:9781680331141Author:HOUGHTON MIFFLIN HARCOURTPublisher:Houghton Mifflin Harcourt
 Holt Mcdougal Larson Pre-algebra: Student Edition...AlgebraISBN:9780547587776Author:HOLT MCDOUGALPublisher:HOLT MCDOUGAL
 Algebra and Trigonometry (MindTap Course List)AlgebraISBN:9781305071742Author:James Stewart, Lothar Redlin, Saleem WatsonPublisher:Cengage Learning
 College AlgebraAlgebraISBN:9781305115545Author:James Stewart, Lothar Redlin, Saleem WatsonPublisher:Cengage Learning