
Concept explainers
Videos
Stopping Distances
In a study on speed control, it was found that the main reasons for regulations were to make traffic flow more efficient and to minimize the risk of danger. An area that was focused on in the study was the distance required to completely stop a vehicle at various speeds. Use the following table to answer the questions.
| MPH | Braking distance (feet) |
| 20 30 40 50 60 80 |
20 45 81 133 205 411 |
Assume MPH is going to be used to predict stopping distance.
1. Which of the two variables is the independent variable?
2. Which is the dependent variable?
3. What type of variable is the independent variable?
4. What type of variable is the dependent variable?
5. Construct a
6. Is there a linear relationship between the two variables?
7. Redraw the scatter plot, and change the distances between the independent-variable numbers. Does the relationship look different?
8. Is the relationship positive or negative?
9. Can braking distance be accurately predicted from MPH?
10.List some other variables that affect braking distance.
11. Compute the value of r.
12. Is r significant at α = 0.05?
1.
To identify: The independent variable.
Answer to Problem 1AC
The independent variable is MPH (miles per hour).
Explanation of Solution
Given info:
The table shows the MPH (miles per hour) and Braking distance in feet.
Calculation:
Independent variable:
If the variable does not dependent on the other variables then the variables are said to be independent variable.
Here, the variable “Miles per hour” does not depend on the other variables. Thus, the independent variable is MPH (miles per hour).
2.
To identify: The dependent variable.
Answer to Problem 1AC
The dependent variable is Braking distance (feet).
Explanation of Solution
Calculation:
Dependent variable:
If the variable depends on the other variables then the variable is said to be dependent variable.
Here, the variable “Braking distance” depends on the other variables. That is the variable braking distance depends on the MPH (miles per hour). Thus, the dependent variable is Braking distance (feet).
3.
The type of variable is the independent variable.
Answer to Problem 1AC
The type of independent variable is the continuous quantitative variable.
Explanation of Solution
Justification:
Continuous quantitative variable:
If the variable takes values on interval scale then the variable is said to be continuous quantitative variable. In the continuous variable, the infinitely many number of values can be considered.
Here, the independent variable miles per hour (MPH) can take any value from a wide range of values. Thus, the independent variable miles per hour (MPH) is continuous quantitative variable.
4.
The type of variable is the dependent variable.
Answer to Problem 1AC
The type of dependent variable is the continuous quantitative variable.
Explanation of Solution
Justification:
Here, the dependent variable braking distance (feet) can take any value from a wide range of values. Thus, the independent variable braking distance (feet) is continuous quantitative variable.
5.
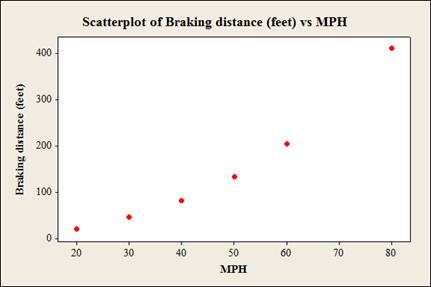
To construct: The scatterplot for the data.
Answer to Problem 1AC
The scatterplot for the data given data using Minitab software is:
Explanation of Solution
Calculation:
The data shows the MPH (miles per hour) and Braking distance (feet) for vehicles.
Step by step procedure to obtain scatterplot using the MINITAB software:
- Choose Graph > Scatterplot.
- Choose Simple and then click OK.
- Under Y variables, enter a column of Braking distance (feet).
- Under X variables, enter a column of MPH.
- Click OK.
6.
To check: Whether there is a linear relationship between the two variables.
Answer to Problem 1AC
Yes, there is a linear relationship between the two variables.
Explanation of Solution
Justification:
The horizontal axis represents miles per hour (MPH) and vertical axis represents braking distance (feet).
From the plot, it is observed that there is a linear relationship between the variables miles per hour (MPH) and braking distance (feet) because the data points show a distinct pattern.
7.
To construct: The scatterplot for the changed data.
To check: Whether the relationship looks different or not.
Answer to Problem 1AC
The scatterplot for the changed data by using Minitab software is:
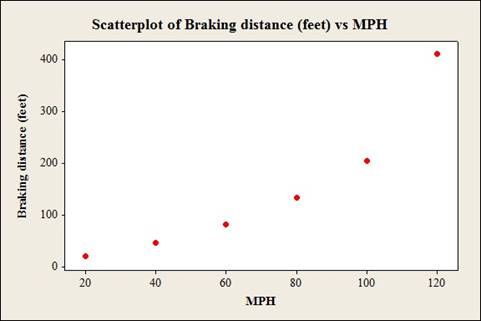
The increments will change the appearance of the relationship if changing the distance between the independent-variable (mph).
Explanation of Solution
Calculation:
The data shows the MPH (miles per hour) and Braking distance (feet) for vehicles.
After changing the distance between the independent-variable numbers, the number of the independent-variable is, 20, 40, 60, 80, 100 and 120.
Step by step procedure to obtain scatterplot using the MINITAB software:
- Choose Graph > Scatterplot.
- Choose Simple and then click OK.
- Under Y variables, enter a column of Braking distance (feet).
- Under X variables, enter a column of MPH.
- Click OK.
Justification:
From the graphs it can be observed that, after changing the distance between the independent-variable (mph), the increments will change the appearance of the relationship.
8.
To check: Whether the relationship is positive or negative.
Answer to Problem 1AC
The relationship is positive.
Explanation of Solution
Justification:
The relationship is positive because the values of independent variable increases then the values of corresponding dependent variable are increases.
9.
To check: Whether the braking distance can be accurately predicted from MPH.
Answer to Problem 1AC
Yes, the braking distance can be accurately predicted from MPH.
Explanation of Solution
Justification:
Here, the braking distance can be accurately predicted from MPH because the relationship between two variables MPH and Breaking distance is strong.
10.
To list: The other variables that affect braking distance.
Answer to Problem 1AC
The other variables that affect braking distance are road conditions, driver response time and condition of the brakes.
Explanation of Solution
Justification:
Answer may wary. One of the possible answers is as follows.
The variable affecting the braking distance are road conditions, driver response time and condition of the brakes.
11.
To compute: The value of r.
Answer to Problem 1AC
The value of r is 0.966.
Explanation of Solution
Calculation:
Correlation coefficient r:
Software Procedure:
Step-by-step procedure to obtain the ‘correlation coefficient’ using the MINITAB software:
- Select Stat > Basic Statistics > Correlation.
- In Variables, select MPH and Braking distance (feet) from the box on the left.
- Click OK.
Output using the MINITAB software is given below:
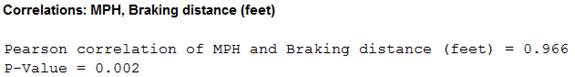
Thus, the Pearson correlation of MPH and Braking distance is 0.966.
12.
To check: Whether or not the r value is significant at 0.05.
Answer to Problem 1AC
Yes, the r value is significant at 0.05.
Explanation of Solution
Calculation:
Here, the r value is significant is checked. So, the claim is that the r value is significant.
The hypotheses are given below:
Null hypothesis:
That is, there is no linear relation between the MPH and Braking distance.
Alternative hypothesis:
That is, there is linear relation between the MPH and Braking distance.
The sample size is 6.
The formula to find the degrees of the freedom is
That is,
From the “TABLE –I: Critical Values for the PPMC”, the critical value for 4 degrees of freedom and
Rejection Rule:
If the absolute value of r is greater than the critical value then reject the null hypothesis.
Conclusion:
From part (11), the Pearson correlation of MPH and Braking distance is 0.966. That is the absolute value of r is 0.966.
Here,
By the rejection rule, reject the null hypothesis.
There is sufficient evidence to support the claim that “there is a linear relation between the MPH and Braking distance”.
Want to see more full solutions like this?
Chapter 10 Solutions
Connect hosted by ALEKS Access Card 52-Week for Elementary Statistics: A Step by Step Approach
Additional Math Textbook Solutions
Introductory Statistics
Elementary & Intermediate Algebra
A First Course in Probability (10th Edition)
Calculus: Early Transcendentals (2nd Edition)
Elementary Statistics: Picturing the World (7th Edition)
Basic College Mathematics


- According to health professionals, a person’s weight is expected to increase with age. To examine that statement, a nutritionist collected data from 11 random females from different age categories between the ages of 21 and 43. In the following table, x is the age of a person and y is the weight in pounds. x, age 21 24 27 29 31 33 35 38 40 42 43 y, weight in lb 121.4 122.3 130.3 131.7 133.3 134.6 136.7 138.4 140.3 142.0 145.1 Select the correct graph of the least-squares line on a scatter diagram.arrow_forwardLet x be a random variable that represents the percentage of successful free throws a professional basketball player makes in a season. Let y be a random variable that represents the percentage of successful field goals a professional basketball player makes in a season. A random sample of n = 6 professional basketball players gave the following information. x 82 69 73 84 74 64 y 42 48 46 46 46 42 Verify that ∑x =446, ∑y =270, ∑x2 =33,442, ∑y2 =12,180, ∑xy =20,070, and r = 0, and find the critical value for a test using a 5% level of significance claiming that ρis not equal than zero. Round your answer to three decimal places.arrow_forwardLet x be a random variable that represents the percentage of successful free throws a professional basketball player makes in a season. Let y be a random variable that represents the percentage of successful field goals a professional basketball player makes in a season. A random sample of n = 6 professional basketball players gave the following information. x 75 72 75 81 74 81 y 46 39 42 47 49 50 Verify that Se ࣈ 3.591,a ࣈ –10.145, bࣈ0.729, and , and find the predicted percentage of successful field goals for a player with x= 88%successful free throws. Round your answer to the nearest tenth of a percentarrow_forward
- An editor wants to analyze if there is a significant difference in the ratings of books in four different genres. Random samples of book ratings were collected for four different genres. The editor recorded ratings in a 0 to 10 scale in the following table. Fiction Novel Biography Science&Technology 8.5 8.4 6.2 9.1 5.3 5.3 5.5 4.3 7.7 4.2 7.0 9.7 5.1 9.8 9.3 5.2 6.9 8.6 6.7 7.9 4.8 7.1 6.9 8.4 Shall we reject or not reject the claim that there are no differences among the population means of book ratings for the different genres? Use.arrow_forwardPeggy conducted a study to identify the randomness of rainy days in fall. For 15 days, she recorded whether it rained that day or not. They denoted a rainy day with the letter R, a day without rain with the letter N. R N N R R N N R R N N R R R R Test the sequence for randomness. Use .arrow_forwardConsider the grades for the math and history exams for 10 students on a scale from 0 to 12 in the following table. Student Math History 1 4 8 2 5 9 3 7 9 4 12 10 5 10 8 6 8 5 7 9 6 8 9 6 9 11 9 10 7 10 Compute the Spearman correlation coefficient. Round your answer to three decimal places.arrow_forward
- To compare two elementary schools regarding teaching of reading skills, 12 sets of identical twins were used. In each case, one child was selected at random and sent to school A, and his or her twin was sent to school B. Near the end of fifth grade, an achievement test was given to each child. The results follow: Twin Pair 1 2 3 4 5 6 School A 169 157 115 99 119 113 School B 123 157 112 99 121 122 Twin Pair 7 8 9 10 11 12 School A 120 121 124 145 138 117 School B 153 90 124 140 142 102 Suppose a sign test for matched pairs with a 1% level of significance is used to test the hypothesis that the schools have the same effectiveness in teaching reading skills against the alternate hypothesis that the schools have different levels of effectiveness in teaching reading skills. Let p denote portion of positive signs when the scores of school B are subtracted from the corresponding scores of school…arrow_forwardA horse trainer teaches horses to jump by using two methods of instruction. Horses being taught by method A have a lead horse that accompanies each jump. Horses being taught by method B have no lead horse. The table shows the number of training sessions required before each horse performed the jumps properly. Method A 25 23 39 29 37 20 Method B 41 21 46 42 24 44 Method A 45 35 27 31 34 49 Method B 26 43 47 32 40 Use a rank-sum test with a5% level of significance to test the claim that there is no difference between the training sessions distributions. If the value of the sample test statistic R, the rank-sum, is 150, calculate the P-value. Round your answer to four decimal places.arrow_forwardA data processing company has a training program for new salespeople. After completing the training program, each trainee is ranked by his or her instructor. After a year of sales, the same class of trainees is again ranked by a company supervisor according to net value of the contracts they have acquired for the company. The results for a random sample of 11 salespeople trained in the last year follow, where x is rank in training class and y is rank in sales after 1 year. Lower ranks mean higher standing in class and higher net sales. Person 1 2 3 4 5 6 x rank 8 11 2 4 5 3 y rank 7 10 1 3 2 4 Person 7 8 9 10 11 x rank 7 9 10 1 6 y rank 8 11 9 6 5 Using a 1% level of significance, test the claim that the relation between x and y is monotone (either increasing or decreasing). Verify that the Spearman rank correlation coefficient . This implies that the P-value lies between 0.002 and 0.01. State…arrow_forward
- Sand and clay studies were conducted at a site in California. Twelve consecutive depths, each about 15 cm deep, were studied and the following percentages of sand in the soil were recorded. 34.4 27.1 30.8 28.0 32.2 27.6 32.8 25.2 31.4 33.5 24.7 28.4 Converting this sequence of numbers to a sequence of symbols A and B, where A indicates a value above the median and B denotes a value below the median gives ABABABABAABB. Test the sequence for randomness about the median with a 5% level of significance. Verify that the number of runs is 10. What is the upper critical value c2? arrow_forwardSand and clay studies were conducted at a site in California. Twelve consecutive depths, each about 15 cm deep, were studied and the following percentages of sand in the soil were recorded. 34.4 27.1 30.8 28.0 32.2 27.6 32.8 25.2 31.4 33.5 24.7 28.4 Converting this sequence of numbers to a sequence of symbols A and B, where A indicates a value above the median and B denotes a value below the median gives ABABABABAABB. Test the sequence for randomness about the median with a 5% level of significance. Verify that the number of runs is 10. What is the upper critical value c2?arrow_forward29% of all college students major in STEM (Science, Technology, Engineering, and Math). If 46 college students are randomly selected, find the probability thata. Exactly 11 of them major in STEM. b. At most 12 of them major in STEM. c. At least 11 of them major in STEM. d. Between 11 and 15 (including 11 and 15) of them major in STEM.arrow_forward
 Glencoe Algebra 1, Student Edition, 9780079039897...AlgebraISBN:9780079039897Author:CarterPublisher:McGraw Hill
 Functions and Change: A Modeling Approach to Coll...AlgebraISBN:9781337111348Author:Bruce Crauder, Benny Evans, Alan NoellPublisher:Cengage Learning
 Big Ideas Math A Bridge To Success Algebra 1: Stu...AlgebraISBN:9781680331141Author:HOUGHTON MIFFLIN HARCOURTPublisher:Houghton Mifflin Harcourt
 Holt Mcdougal Larson Pre-algebra: Student Edition...AlgebraISBN:9780547587776Author:HOLT MCDOUGALPublisher:HOLT MCDOUGAL
 College AlgebraAlgebraISBN:9781305115545Author:James Stewart, Lothar Redlin, Saleem WatsonPublisher:Cengage Learning
 Algebra and Trigonometry (MindTap Course List)AlgebraISBN:9781305071742Author:James Stewart, Lothar Redlin, Saleem WatsonPublisher:Cengage Learning