
Statistics Through Applications
2nd Edition
ISBN: 9781429219747
Author: Daren S. Starnes, David Moore, Dan Yates
Publisher: Macmillan Higher Education
expand_more
expand_more
format_list_bulleted
Concept explainers
Videos
Question
Chapter 10.1, Problem 10.27E
To determine
To Explain: the differences between the distributions of majors for women and man with percents, with a graph and in word.
Expert Solution & Answer
Explanation of Solution
Given:
| Female | Male | |
| Accounting | 68 | 56 |
| Administration | 91 | 40 |
| Economics | 5 | 6 |
| Finance | 61 | 59 |
Calculation:
Totals of row and column
| Female | Male | Total | |
| Accounting | 68 | 56 | 124 |
| Administration | 91 | 40 | 131 |
| Economics | 5 | 6 | 11 |
| Finance | 61 | 59 | 120 |
| Total | 225 | 161 | 386 |
Percentage of male and female
| Female | Male | Total | ||
| Accounting | Observed | 68 | 56 | 124 |
| % of column | 30.2% | 34.8% | 32.1% | |
| Administration | Observed | 91 | 40 | 131 |
| % of column | 40.4% | 24.8% | 33.9% | |
| Economics | Observed | 5 | 6 | 11 |
| % of column | 2.2% | 3.7% | 2.8% | |
| Finance | Observed | 61 | 59 | 120 |
| % of column | 27.1% | 36.6% | 31.1% | |
| Total | Observed | 225 | 161 | 386 |
| % of column | 100.0% | 100.0% | 100.0% |
Graph:
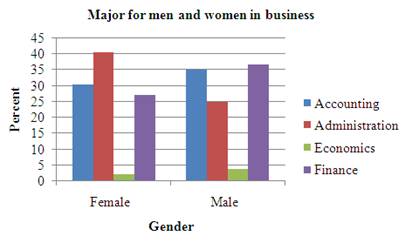
By seeing the bar graph it is clearly representing that the mainly women in the administration and very less in economics where in accounting and finance are common.
Most of the men are in the accounting and then after finance and very less in economics and very common in administration.
Chapter 10 Solutions
Statistics Through Applications
Ch. 10.1 - Prob. 10.1ECh. 10.1 - Prob. 10.2ECh. 10.1 - Prob. 10.3ECh. 10.1 - Prob. 10.4ECh. 10.1 - Prob. 10.5ECh. 10.1 - Prob. 10.6ECh. 10.1 - Prob. 10.7ECh. 10.1 - Prob. 10.8ECh. 10.1 - Prob. 10.9ECh. 10.1 - Prob. 10.10E
Ch. 10.1 - Prob. 10.11ECh. 10.1 - Prob. 10.12ECh. 10.1 - Prob. 10.13ECh. 10.1 - Prob. 10.14ECh. 10.1 - Prob. 10.15ECh. 10.1 - Prob. 10.16ECh. 10.1 - Prob. 10.17ECh. 10.1 - Prob. 10.18ECh. 10.1 - Prob. 10.19ECh. 10.1 - Prob. 10.20ECh. 10.1 - Prob. 10.21ECh. 10.1 - Prob. 10.22ECh. 10.1 - Prob. 10.23ECh. 10.1 - Prob. 10.24ECh. 10.1 - Prob. 10.25ECh. 10.1 - Prob. 10.26ECh. 10.1 - Prob. 10.27ECh. 10.1 - Prob. 10.28ECh. 10.1 - Prob. 10.29ECh. 10.1 - Prob. 10.30ECh. 10.1 - Prob. 10.31ECh. 10.1 - Prob. 10.32ECh. 10.2 - Prob. 10.33ECh. 10.2 - Prob. 10.34ECh. 10.2 - Prob. 10.35ECh. 10.2 - Prob. 10.36ECh. 10.2 - Prob. 10.37ECh. 10.2 - Prob. 10.38ECh. 10.2 - Prob. 10.39ECh. 10.2 - Prob. 10.40ECh. 10.2 - Prob. 10.41ECh. 10.2 - Prob. 10.42ECh. 10.2 - Prob. 10.43ECh. 10.2 - Prob. 10.44ECh. 10.2 - Prob. 10.45ECh. 10.2 - Prob. 10.46ECh. 10.2 - Prob. 10.47ECh. 10.2 - Prob. 10.48ECh. 10.2 - Prob. 10.49ECh. 10.2 - Prob. 10.50ECh. 10.2 - Prob. 10.51ECh. 10.2 - Prob. 10.52ECh. 10.2 - Prob. 10.53ECh. 10.2 - Prob. 10.54ECh. 10.2 - Prob. 10.55ECh. 10.2 - Prob. 10.56ECh. 10.2 - Prob. 10.57ECh. 10.2 - Prob. 10.58ECh. 10 - Prob. 10.59RECh. 10 - Prob. 10.60RECh. 10 - Prob. 10.61RECh. 10 - Prob. 10.62RECh. 10 - Prob. 10.63RECh. 10 - Prob. 10.64RECh. 10 - Prob. 10.65RECh. 10 - Prob. 10.66RECh. 10 - Prob. 10.67RECh. 10 - Prob. 10.68RE
Additional Math Textbook Solutions
Find more solutions based on key concepts
Finding Cartesian from Parametric Equations
Exercises 1–18 give parametric equations and parameter intervals fo...
University Calculus: Early Transcendentals (4th Edition)
4. Correlation and Causation What is meant by the statement that “correlation does imply causation”?
Elementary Statistics
Violins Professional musicians listened to five violins being played, without seeing the instruments. One violi...
Introductory Statistics
Fill in each blank so that the resulting statement is true. Any set of ordered pairs is called a/an ____.The se...
Algebra and Trigonometry (6th Edition)
The following set of data is from sample of n=5: a. Compute the mean, median, and mode. b. Compute the range, v...
Basic Business Statistics, Student Value Edition
1. Continuity Correction In testing the assumption that the probability of a baby boy is 0.512, a geneticist ob...
Elementary Statistics (13th Edition)
Knowledge Booster


Learn more about
Need a deep-dive on the concept behind this application? Look no further. Learn more about this topic, statistics and related others by exploring similar questions and additional content below.Similar questions
- Business discussarrow_forwardBusiness discussarrow_forwardI just need to know why this is wrong below: What is the test statistic W? W=5 (incorrect) and What is the p-value of this test? (p-value < 0.001-- incorrect) Use the Wilcoxon signed rank test to test the hypothesis that the median number of pages in the statistics books in the library from which the sample was taken is 400. A sample of 12 statistics books have the following numbers of pages pages 127 217 486 132 397 297 396 327 292 256 358 272 What is the sum of the negative ranks (W-)? 75 What is the sum of the positive ranks (W+)? 5What type of test is this? two tailedWhat is the test statistic W? 5 These are the critical values for a 1-tailed Wilcoxon Signed Rank test for n=12 Alpha Level 0.001 0.005 0.01 0.025 0.05 0.1 0.2 Critical Value 75 70 68 64 60 56 50 What is the p-value for this test? p-value < 0.001arrow_forward
- ons 12. A sociologist hypothesizes that the crime rate is higher in areas with higher poverty rate and lower median income. She col- lects data on the crime rate (crimes per 100,000 residents), the poverty rate (in %), and the median income (in $1,000s) from 41 New England cities. A portion of the regression results is shown in the following table. Standard Coefficients error t stat p-value Intercept -301.62 549.71 -0.55 0.5864 Poverty 53.16 14.22 3.74 0.0006 Income 4.95 8.26 0.60 0.5526 a. b. Are the signs as expected on the slope coefficients? Predict the crime rate in an area with a poverty rate of 20% and a median income of $50,000. 3. Using data from 50 workarrow_forward2. The owner of several used-car dealerships believes that the selling price of a used car can best be predicted using the car's age. He uses data on the recent selling price (in $) and age of 20 used sedans to estimate Price = Po + B₁Age + ε. A portion of the regression results is shown in the accompanying table. Standard Coefficients Intercept 21187.94 Error 733.42 t Stat p-value 28.89 1.56E-16 Age -1208.25 128.95 -9.37 2.41E-08 a. What is the estimate for B₁? Interpret this value. b. What is the sample regression equation? C. Predict the selling price of a 5-year-old sedan.arrow_forwardian income of $50,000. erty rate of 13. Using data from 50 workers, a researcher estimates Wage = Bo+B,Education + B₂Experience + B3Age+e, where Wage is the hourly wage rate and Education, Experience, and Age are the years of higher education, the years of experience, and the age of the worker, respectively. A portion of the regression results is shown in the following table. ni ogolloo bash 1 Standard Coefficients error t stat p-value Intercept 7.87 4.09 1.93 0.0603 Education 1.44 0.34 4.24 0.0001 Experience 0.45 0.14 3.16 0.0028 Age -0.01 0.08 -0.14 0.8920 a. Interpret the estimated coefficients for Education and Experience. b. Predict the hourly wage rate for a 30-year-old worker with four years of higher education and three years of experience.arrow_forward
- 1. If a firm spends more on advertising, is it likely to increase sales? Data on annual sales (in $100,000s) and advertising expenditures (in $10,000s) were collected for 20 firms in order to estimate the model Sales = Po + B₁Advertising + ε. A portion of the regression results is shown in the accompanying table. Intercept Advertising Standard Coefficients Error t Stat p-value -7.42 1.46 -5.09 7.66E-05 0.42 0.05 8.70 7.26E-08 a. Interpret the estimated slope coefficient. b. What is the sample regression equation? C. Predict the sales for a firm that spends $500,000 annually on advertising.arrow_forwardCan you help me solve problem 38 with steps im stuck.arrow_forwardHow do the samples hold up to the efficiency test? What percentages of the samples pass or fail the test? What would be the likelihood of having the following specific number of efficiency test failures in the next 300 processors tested? 1 failures, 5 failures, 10 failures and 20 failures.arrow_forward
- The battery temperatures are a major concern for us. Can you analyze and describe the sample data? What are the average and median temperatures? How much variability is there in the temperatures? Is there anything that stands out? Our engineers’ assumption is that the temperature data is normally distributed. If that is the case, what would be the likelihood that the Safety Zone temperature will exceed 5.15 degrees? What is the probability that the Safety Zone temperature will be less than 4.65 degrees? What is the actual percentage of samples that exceed 5.25 degrees or are less than 4.75 degrees? Is the manufacturing process producing units with stable Safety Zone temperatures? Can you check if there are any apparent changes in the temperature pattern? Are there any outliers? A closer look at the Z-scores should help you in this regard.arrow_forwardNeed help pleasearrow_forwardPlease conduct a step by step of these statistical tests on separate sheets of Microsoft Excel. If the calculations in Microsoft Excel are incorrect, the null and alternative hypotheses, as well as the conclusions drawn from them, will be meaningless and will not receive any points. 4. One-Way ANOVA: Analyze the customer satisfaction scores across four different product categories to determine if there is a significant difference in means. (Hints: The null can be about maintaining status-quo or no difference among groups) H0 = H1=arrow_forward
arrow_back_ios
SEE MORE QUESTIONS
arrow_forward_ios
Recommended textbooks for you
 MATLAB: An Introduction with ApplicationsStatisticsISBN:9781119256830Author:Amos GilatPublisher:John Wiley & Sons Inc
 Probability and Statistics for Engineering and th...StatisticsISBN:9781305251809Author:Jay L. DevorePublisher:Cengage Learning
 Statistics for The Behavioral Sciences (MindTap C...StatisticsISBN:9781305504912Author:Frederick J Gravetter, Larry B. WallnauPublisher:Cengage Learning
 Elementary Statistics: Picturing the World (7th E...StatisticsISBN:9780134683416Author:Ron Larson, Betsy FarberPublisher:PEARSON
 The Basic Practice of StatisticsStatisticsISBN:9781319042578Author:David S. Moore, William I. Notz, Michael A. FlignerPublisher:W. H. Freeman
 Introduction to the Practice of StatisticsStatisticsISBN:9781319013387Author:David S. Moore, George P. McCabe, Bruce A. CraigPublisher:W. H. Freeman
MATLAB: An Introduction with Applications
Statistics
ISBN:9781119256830
Author:Amos Gilat
Publisher:John Wiley & Sons Inc
Probability and Statistics for Engineering and th...
Statistics
ISBN:9781305251809
Author:Jay L. Devore
Publisher:Cengage Learning
Statistics for The Behavioral Sciences (MindTap C...
Statistics
ISBN:9781305504912
Author:Frederick J Gravetter, Larry B. Wallnau
Publisher:Cengage Learning
Elementary Statistics: Picturing the World (7th E...
Statistics
ISBN:9780134683416
Author:Ron Larson, Betsy Farber
Publisher:PEARSON
The Basic Practice of Statistics
Statistics
ISBN:9781319042578
Author:David S. Moore, William I. Notz, Michael A. Fligner
Publisher:W. H. Freeman
Introduction to the Practice of Statistics
Statistics
ISBN:9781319013387
Author:David S. Moore, George P. McCabe, Bruce A. Craig
Publisher:W. H. Freeman
The Shape of Data: Distributions: Crash Course Statistics #7; Author: CrashCourse;https://www.youtube.com/watch?v=bPFNxD3Yg6U;License: Standard YouTube License, CC-BY
Shape, Center, and Spread - Module 20.2 (Part 1); Author: Mrmathblog;https://www.youtube.com/watch?v=COaid7O_Gag;License: Standard YouTube License, CC-BY
Shape, Center and Spread; Author: Emily Murdock;https://www.youtube.com/watch?v=_YyW0DSCzpM;License: Standard Youtube License