
Concept explainers
Videos
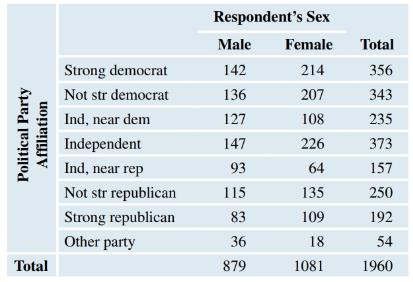
Gender and Political Party Affiliation The data in the table are from a General Social Survey and concern gender and political party.
a. Find the expected counts and report the smallest. Could we use the table as is, without combining categories?
b. Create a new table, using the data from the table shown, with fewer categories. Merge the Strong Democrat and the Not Strong Democrat categories into one group called Democrats. Merge the Strong Republican and the Not Strong Republican categories into one group called Republicans. Put all the Independent categories and the Other category into one group called Other.
c. What percentage of the women and what percentage of the men are Democrats? Compare these percentages.
d. Assume that conditions are met, and do a chi-square test with a significance level of
Political Party Affiliation
Want to see the full answer?
Check out a sample textbook solution
Chapter 10 Solutions
Pearson eText Introductory Statistics: Exploring the World Through Data -- Instant Access (Pearson+)
Additional Math Textbook Solutions
Math in Our World
Elementary Statistics ( 3rd International Edition ) Isbn:9781260092561
A First Course in Probability (10th Edition)
Mathematics for the Trades: A Guided Approach (11th Edition) (What's New in Trade Math)
Precalculus
Intermediate Algebra (13th Edition)


- Business Discussarrow_forwardThe following data represent total ventilation measured in liters of air per minute per square meter of body area for two independent (and randomly chosen) samples. Analyze these data using the appropriate non-parametric hypothesis testarrow_forwardeach column represents before & after measurements on the same individual. Analyze with the appropriate non-parametric hypothesis test for a paired design.arrow_forward
- Should you be confident in applying your regression equation to estimate the heart rate of a python at 35°C? Why or why not?arrow_forwardGiven your fitted regression line, what would be the residual for snake #5 (10 C)?arrow_forwardCalculate the 95% confidence interval around your estimate of r using Fisher’s z-transformation. In your final answer, make sure to back-transform to the original units.arrow_forward
 Holt Mcdougal Larson Pre-algebra: Student Edition...AlgebraISBN:9780547587776Author:HOLT MCDOUGALPublisher:HOLT MCDOUGAL
 Glencoe Algebra 1, Student Edition, 9780079039897...AlgebraISBN:9780079039897Author:CarterPublisher:McGraw Hill
 Big Ideas Math A Bridge To Success Algebra 1: Stu...AlgebraISBN:9781680331141Author:HOUGHTON MIFFLIN HARCOURTPublisher:Houghton Mifflin Harcourt
 College Algebra (MindTap Course List)AlgebraISBN:9781305652231Author:R. David Gustafson, Jeff HughesPublisher:Cengage Learning