Concept introduction:
Budget Line: It is defined as the combination of all goods that a consumer can buy exhausting his all income. Formula for the budget line is:
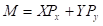
Here,
 is the quantity of good X.
  is the quantity of good Y.
  is the total income.
  is the
 price of good X. is the price of good Y.
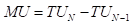
 is the marginal utility.
  is the total utility.
 - X is the quantity of any good.
- N is the number of goods.
 is the marginal utility per dollar.
  is the price of good X.
  is the marginal utility of good X.
  is the marginal utility of good Y.
  is the price of good X.
  is the price of good Y.
 Or
Or

Here,
Marginal Utility per dollar: It is the ratio of marginal utility to that of the price of a good. The formula to calculate the marginal utility per dollar is:


Here,
Maximizing utility in the case of two goods: It states that the equilibrium level of consumption of two goods for a consumer is achieved when the marginal utility per dollar of the two goods are equal. This means that the following conditions must be fulfilled:

Here,
Explanation of Solution
a. Mr. Bernie’s consumption bundles of notebooks and mp3s.
Given that the total income of Mr. Bernie is  the price of mp3 and notebook is
 and
and  respectively. Then the consumption bundles of Mr. Bernie suppose that he spends all his income is calculated as follows:

| Quantity of mp3s | Quantity of notebooks |  ($) ($) | ||
| 10 | 0 | 20 | ||
| 8 | 1 | 20 | ||
| 6 | 2 | 20 | ||
| 4 | 3 | 20 | ||
| 2 | 4 | 20 | ||
| 0 | 5 | 20 | ||
| Table(1) | ||||
From the above table, the bundles which can be consumed by Mr. Bernie, if he spends all his income are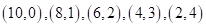 and
and 
The below graph shows the budget line of Mr. Bernie based on the above table:
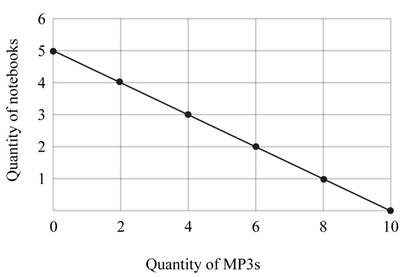
Fig 1
- The above figure shows the various combinations of goods which Mr. Bernie can consume spending all his income.
- The Quantity of Mp3s is represented by the x-axis and the quantity of notebooks is represented by the y-axis.
- When he spends all his income on the mp3s, the bundle is
 if he spends all his income on the notebook, then the bundle is
Conclusion:
Thus, Mr. Bernie’s consumption bundles are calculated using table 1 and shown in the fig 1.
b. Mr. Bernie’s Marginal Utility of mp3s and notebook.
The below table shows the calculation of marginal utility and marginal utility per dollar. The formula used for the calculation is given in the concept introduction.
| Quantity of mp3 | Total utility of mp3 | Marginal utility of each mp3 | Marginal Utility per dollar | |
| 0 | 0 | - | - | |
| 2 | 28 | 14 | 7 | |
| 4 | 52 | 12 | 6 | |
| 6 | 72 | 10 | 5 | |
| 8 | 96 | 12 | 6 | |
| 10 | 108 | 6 | 3 | |
| Table(2) | ||||
| Quantity of notebooks | Total utility of notebooks | Marginal utility of each notebooks | Marginal Utility per dollar | |
| 0 | 0 | - | - | |
| 1 | 32 | 32 | 8 | |
| 2 | 60 | 28 | 7 | |
| 3 | 84 | 24 | 6 | |
| 4 | 104 | 20 | 5 | |
| 5 | 120 | 16 | 4 | |
| Table(3) | ||||
Conclusion:
Thus, marginal utility and marginal utility per dollar are calculated above.
c. Utility maximizing principle.
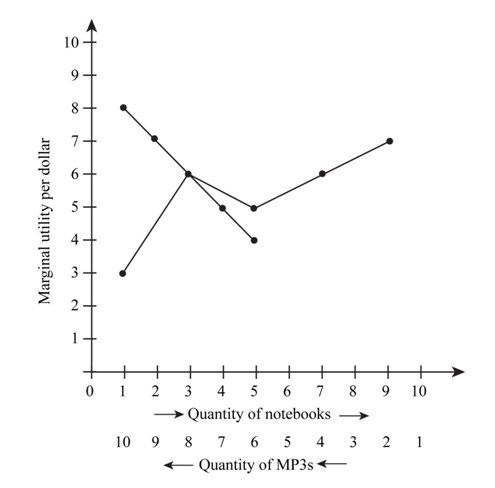
Fig 2
- In the figure 2, the x-axis represents the quantity of notebooks in the right direction and the quantity of mp3s in the left direction.
- The y-axis represents the marginal utility per dollar. In the figure 2, it is clearly observed that the marginal utility per dollar of both goods are equal at 3 notebooks and 8 mp3s. So, this is the optimum bundle.
Conclusion:
Thus, the optimum bundle is  which means 8 mp3s and 3 notebooks.
Want to see more full solutions like this?
Chapter 10 Solutions
EBK ECONOMICS

- Describe the various measures used to assess poverty and economic inequality. Analyze the causes and consequences of poverty and inequality, and discuss potential policies and programs aimed at reducing them, assess the adequacy of current environmental regulations in addressing negative externalities. analyze the role of labor unions in labor markets. What is one benefit, and one challenge associated with labor unions.arrow_forwardEvaluate the effectiveness of supply and demand models in predicting labor market outcomes. Justify your assessment with specific examples from real-world labor markets.arrow_forwardExplain the difference between Microeconomics and Macroeconomics? 2.) Explain what fiscal policy is and then explain what Monetary Policy is? 3.) Why is opportunity cost and give one example from your own of opportunity cost. 4.) What are models and what model did we already discuss in class? 5.) What is meant by scarcity of resources?arrow_forward
- 2. What is the payoff from a long futures position where you are obligated to buy at the contract price? What is the payoff from a short futures position where you are obligated to sell at the contract price?? Draw the payoff diagram for each position. Payoff from Futures Contract F=$50.85 S1 Long $100 $95 $90 $85 $80 $75 $70 $65 $60 $55 $50.85 $50 $45 $40 $35 $30 $25 Shortarrow_forward3. Consider a call on the same underlier (Cisco). The strike is $50.85, which is the forward price. The owner of the call has the choice or option to buy at the strike. They get to see the market price S1 before they decide. We assume they are rational. What is the payoff from owning (also known as being long) the call? What is the payoff from selling (also known as being short) the call? Payoff from Call with Strike of k=$50.85 S1 Long $100 $95 $90 $85 $80 $75 $70 $65 $60 $55 $50.85 $50 $45 $40 $35 $30 $25 Shortarrow_forward4. Consider a put on the same underlier (Cisco). The strike is $50.85, which is the forward price. The owner of the call has the choice or option to buy at the strike. They get to see the market price S1 before they decide. We assume they are rational. What is the payoff from owning (also known as being long) the put? What is the payoff from selling (also known as being short) the put? Payoff from Put with Strike of k=$50.85 S1 Long $100 $95 $90 $85 $80 $75 $70 $65 $60 $55 $50.85 $50 $45 $40 $35 $30 $25 Shortarrow_forward
- The following table provides information on two technology companies, IBM and Cisco. Use the data to answer the following questions. Company IBM Cisco Systems Stock Price Dividend (trailing 12 months) $150.00 $50.00 $7.00 Dividend (next 12 months) $7.35 Dividend Growth 5.0% $2.00 $2.15 7.5% 1. You buy a futures contract instead of purchasing Cisco stock at $50. What is the one-year futures price, assuming the risk-free interest rate is 6%? Remember to adjust the futures price for the dividend of $2.15.arrow_forward5. Consider a one-year European-style call option on Cisco stock. The strike is $50.85, which is the forward price. The risk-free interest rate is 6%. Assume the stock price either doubles or halves each period. The price movement corresponds to u = 2 and d = ½ = 1/u. S1 = $100 Call payoff= SO = $50 S1 = $25 Call payoff= What is the call payoff for $1 = $100? What is the call payoff for S1 = $25?arrow_forwardMC The diagram shows a pharmaceutical firm's demand curve and marginal cost curve for a new heart medication for which the firm holds a 20-year patent on its production. Assume this pharmaceutical firm charges a single price for its drug. At its profit-maximizing level of output, it will generate a total profit represented by OA. areas J+K. B. areas F+I+H+G+J+K OC. areas E+F+I+H+G. D. - it is not possible to determine with the informatio OE. the sum of areas A through K. (...) Po P1 Price F P2 E H 0 G B Q MR D ōarrow_forward
- Price Quantity $26 0 The marketing department of $24 20,000 Johnny Rockabilly's record company $22 40,000 has determined that the demand for his $20 60,000 latest CD is given in the table at right. $18 80,000 $16 100,000 $14 120,000 The record company's costs consist of a $240,000 fixed cost of recording the CD, an $8 per CD variable cost of producing and distributing the CD, plus the cost of paying Johnny for his creative talent. The company is considering two plans for paying Johnny. Plan 1: Johnny receives a zero fixed recording fee and a $4 per CD royalty for each CD that is sold. Plan 2: Johnny receives a $400,000 fixed recording fee and zero royalty per CD sold. Under either plan, the record company will choose the price of Johnny's CD so as to maximize its (the record company's) profit. The record company's profit is the revenues minus costs, where the costs include the costs of production, distribution, and the payment made to Johnny. Johnny's payment will be be under plan 2 as…arrow_forwardWhich of the following is the best example of perfect price discrimination? A. Universities give entry scholarships to poorer students. B. Students pay lower prices at the local theatre. ○ C. A hotel charges for its rooms according to the number of days left before the check-in date. ○ D. People who collect the mail coupons get discounts at the local food store. ○ E. An airline offers a discount to students.arrow_forwardConsider the figure at the right. The profit of the single-price monopolist OA. is shown by area D+H+I+F+A. B. is shown by area A+I+F. OC. is shown by area D + H. ○ D. is zero. ○ E. cannot be calculated or shown with just the information given in the graph. (C) Price ($) B C D H FIG шо E MC ATC A MR D = AR Quantityarrow_forward

 Principles of Economics (12th Edition)EconomicsISBN:9780134078779Author:Karl E. Case, Ray C. Fair, Sharon E. OsterPublisher:PEARSON
 Engineering Economy (17th Edition)EconomicsISBN:9780134870069Author:William G. Sullivan, Elin M. Wicks, C. Patrick KoellingPublisher:PEARSON
 Principles of Economics (MindTap Course List)EconomicsISBN:9781305585126Author:N. Gregory MankiwPublisher:Cengage Learning
 Managerial Economics: A Problem Solving ApproachEconomicsISBN:9781337106665Author:Luke M. Froeb, Brian T. McCann, Michael R. Ward, Mike ShorPublisher:Cengage Learning
 Managerial Economics & Business Strategy (Mcgraw-...EconomicsISBN:9781259290619Author:Michael Baye, Jeff PrincePublisher:McGraw-Hill Education