The leverage ratio for the banks with respect to the total assets and bank capital and to ascertain the moral hazards on the banks over the time.
Concept Introduction:
Leverage Ratio: Leverage ratio indicates the debts of a company against its several accounts. Bank capital is a part of debt.
Moral Hazards: Person would take the risk on a condition wherein the other person would suffer the consequences.
Explanation of Solution
Bank Leverage Ratio 1990
| January | July | |||
| Bank Capital | 206.2938 | Bank Capital | 216.4139 | |
| Total Assets | 3151.4032 | Total Assets | 3254.435 | |
| Leverage Ratio | 0.065461 | Leverage Ratio | 0.066498 | |
| February | August | |||
| Bank Capital | 216.4620 | Bank Capital | 214.1683 | |
| Total Assets | 3164.7700 | Total Assets | 3282.767 | |
| Leverage Ratio | 0.068397 | Leverage Ratio | 0.06524 | |
| March | September | |||
| Bank Capital | 211.8968 | Bank Capital | 219.6109 | |
| Total Assets | 3184.0284 | Total Assets | 3279.031 | |
| Leverage Ratio | 0.06655 | Leverage Ratio | 0.066974 | |
| April | October | |||
| Bank Capital | 214.9664 | Bank Capital | 218.4562 | |
| Total Assets | 3197.3688 | Total Assets | 3275.413 | |
| Leverage Ratio | 0.067232 | Leverage Ratio | 0.066696 | |
| May | November | |||
| Bank Capital | 213.0511 | Bank Capital | 216.9110 | |
| Total Assets | 3205.8259 | Total Assets | 3279.432 | |
| Leverage Ratio | 0.066457 | Leverage Ratio | 0.066143 | |
| June | December | |||
| Bank Capital | 217.2948 | Bank Capital | 219.9433 | |
| Total Assets | 3234.4319 | Total Assets | 3285.839 | |
| Leverage Ratio | 0.067182 | Leverage Ratio | 0.066937 | |
| January | 0.065461 |
| February | 0.068397 |
| March | 0.06655 |
| April | 0.067232 |
| May | 0.066457 |
| June | 0.067182 |
| July | 0.066498 |
| August | 0.06524 |
| September | 0.666974 |
| October | 0.66696 |
| November | 0.066143 |
| December | 0.066937 |
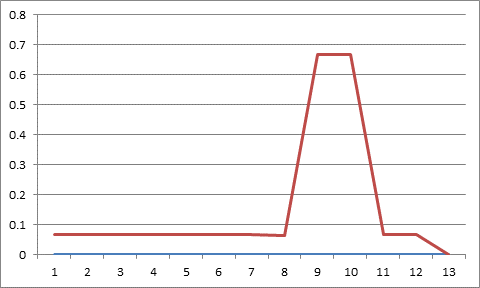
Bank Leverage Ratio 1990
The leverage ratio of the banks during the time period 1990 is indicated in the below graph.
| Bank Leverage ratio 2018 | |
| January | |
| Bank Capital | 1852.716 |
| Total Assets | 16758.4 |
| Leverage Ratio | 0.110554 |
| February | |
| Bank Capital | 1839.269 |
| Total Assets | 16729.74 |
| Leverage Ratio | 0.10994 |
| March | |
| Bank Capital | 1850.533 |
| Total Assets | 16695.79 |
| Leverage Ratio | 0.110838 |
| April | |
| Bank Capital | 1836.656 |
| Total Assets | 16621.14 |
| Leverage Ratio | 0.110501 |
| January | 0.110554 |
| February | 0.10994 |
| March | 0.110838 |
| April | 0.110501 |
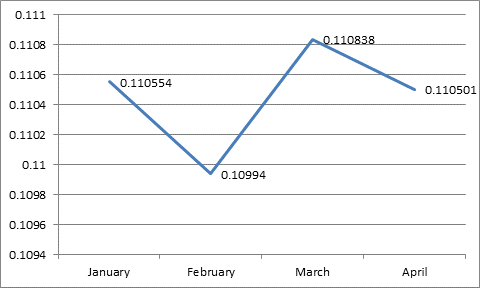
Bank Leverage ratio 2018
The leverage ratio graph indicates that it has dropped during February and has increased during March. The values are fluctuating since the beginning of 2018.
Explanation: The calculations have been carried to identify the leverage ratios for every month during the period 1990 and 2018. From the calculations done for every month, it was identified that the leverage ratio for the commercial banks with respect to the capital and the assets during 1990 was around 0.06. It was identified that if the leverage ratio is high, the
The probability of depositors getting affected in investing in the banks with low ability to repay its credit could be higher. Therefore, Moral Hazard problems could be less for the customers of the US commercial banks in 2018 compared to 1990. The leverage ratio is much higher in 2018 compared to1990.
Want to see more full solutions like this?
Chapter 10 Solutions
Economics of Money, Banking and Financial Markets, The, Business School Edition (5th Edition) (What's New in Economics)

- In 1932 babe Ruth made $75,000. How much is that in todays dollars please give the right answer step by steparrow_forwardEvaluate machine XYZ when MARR is 12% per year. Pertinent data are as follows: Machine XYZ Investment cost Expected life Market (salvage) value Annual revenue Annual expenses $10,000 5 years $1,000 $8,000 $4,000 How much is the excess of the cash flow using the Annual Worth Method? Blank 1 Calculate the External Rate of Return. Blank 2 Compute the payback period of the investment. Blank 3 Would you recommend this investment? Explain briefly. Blank 4arrow_forwardPlease make sure to answer each step and show work. Thank you!arrow_forward
- HW Ch5 Calculate the daily total revenue when the market price is $180, $160, $140, $120, $100, $80, $60, and $40 per bippitybop. Then, use the green point (triangle symbol) to plot the daily total revenue against quantity corresponding to these market prices on the following graph. 2 @ 3840 3520 3200+ 2880 2560+ 2240 TOTAL REVENUE (Dollars) 1920 1600 1280 960 + 640+ 0 0 8 16 24 32 40 48 56 64 72 80 QUANTITY (Bippitybops per day) Total Revenue ? According to the midpoints formula, the price elasticity of demand between points A and B on the initial graph is approximately . Suppose the price of bippitybops is currently $60 per bippitybop, shown as point A on the initial graph. Because the price elasticity of demand between points A and B is , a $20-per-bippitybop decrease in price will lead to MacBook Air in total revenue per day. F2 80 F3 #3 $ 4 5 6 F6 < F7 * 8 & 27 DII 8 F8 F9 F10 61 0 W E R T Y U 0 P S D LL F G H J K Larrow_forwardNot use ai pleasearrow_forwardChina is a leader in international trade, has one of the highest GDPs, and currently holds the largest foreign exchange reserve in the world. Is it fair for China to fix its currency by undervaluing it on the market? How does keeping its currency undervalued give it a favorable position in international trade? What about from the viewpoints of international companies and consumers?arrow_forward

 Principles of Economics (12th Edition)EconomicsISBN:9780134078779Author:Karl E. Case, Ray C. Fair, Sharon E. OsterPublisher:PEARSON
 Engineering Economy (17th Edition)EconomicsISBN:9780134870069Author:William G. Sullivan, Elin M. Wicks, C. Patrick KoellingPublisher:PEARSON
 Principles of Economics (MindTap Course List)EconomicsISBN:9781305585126Author:N. Gregory MankiwPublisher:Cengage Learning
 Managerial Economics: A Problem Solving ApproachEconomicsISBN:9781337106665Author:Luke M. Froeb, Brian T. McCann, Michael R. Ward, Mike ShorPublisher:Cengage Learning
 Managerial Economics & Business Strategy (Mcgraw-...EconomicsISBN:9781259290619Author:Michael Baye, Jeff PrincePublisher:McGraw-Hill Education