Concept explainers
Videos
A.
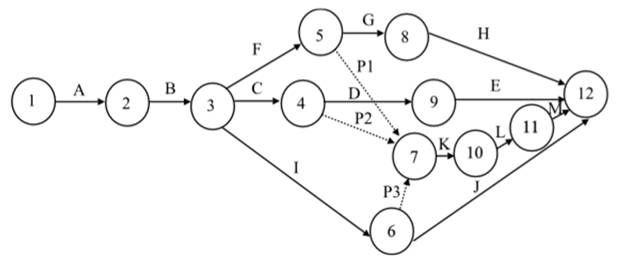
Interpretation: A network diagram representing the activities of the project is to be constructed.
Concept Introduction: Network diagram is a graphical representation of tasks and events happening in a project. It depicts the work flow and is used to compute the total duration of the project.
A.
Explanation of Solution
Given information: Theactivities to be taken up for the construction of a gas station and the time duration for each are given in the table.
| Activity | Time |
| A | 4 |
| B | 2 |
| C | 3 |
| D | 1 |
| E | 1 |
| F | 2 |
| G | 3 |
| H | 1 |
| I | 5 |
| J | 3 |
| K | 4 |
| L | 2 |
| M | 1 |
The activity times and the precedence relationship are shown in the table:
| Activity | Time | Predecessors |
| A | 4 | |
| B | 2 | A |
| C | 3 | B |
| D | 1 | C |
| E | 1 | D |
| F | 2 | B |
| G | 3 | F |
| H | 1 | G |
| I | 5 | B |
| J | 3 | I |
| K | 4 | C, F, I |
| L | 2 | K |
| M | 1 | L |
The network diagram showing the work flows is as follows:
B.
Interpretation: The critical path is to be identified by computing the earliest and the latest start and finish times.
Concept Introduction: Network diagram is a graphical representation of tasks and events happening in a project. It depicts the work flow and is used to compute the total duration of the project.
B.
Answer to Problem 26AP
The critical path is A − B − I − K − L − M with completion time as 18 weeks
Explanation of Solution
Given information:
| Activity | Time |
| A | 4 |
| B | 2 |
| C | 3 |
| D | 1 |
| E | 1 |
| F | 2 |
| G | 3 |
| H | 1 |
| I | 5 |
| J | 3 |
| K | 4 |
| L | 2 |
| M | 1 |

The earliest and latest start and finish times are calculated using the formulae:
Earliest Start (EST) = Maximum EFT of the predecessor activity
Latest Start (LST) = LFT - Duration
Earliest Finish (EFT) = EST + Duration
Latest Finish (LFT) = Minimum LST of the immediate successor
Slack = LFT − EFT (or) LST − EST
| Activity | Time | EST | EFT | LST | LFT | Slack |
| A | 4 | 0 | 4 | 0 | 4 | 0 |
| B | 2 | 4 | 6 | 4 | 6 | 0 |
| C | 3 | 6 | 9 | 8 | 11 | 2 |
| D | 1 | 9 | 10 | 16 | 17 | 7 |
| E | 1 | 10 | 11 | 17 | 18 | 7 |
| F | 2 | 6 | 8 | 9 | 11 | 3 |
| G | 3 | 8 | 11 | 14 | 17 | 6 |
| H | 1 | 11 | 12 | 17 | 18 | 6 |
| I | 5 | 6 | 11 | 6 | 11 | 0 |
| J | 3 | 11 | 14 | 15 | 18 | 4 |
| K | 4 | 11 | 15 | 11 | 15 | 0 |
| L | 2 | 15 | 17 | 15 | 17 | 0 |
| M | 1 | 17 | 18 | 17 | 18 | 0 |
The critical path includes the activities with zero slack. So, here the critical path is A − B− I − K − L − M. The total time taken to complete the project is 18 weeks.
C.
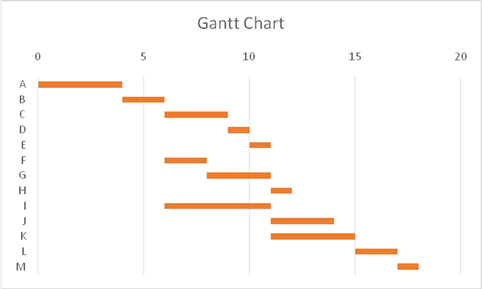
Interpretation: A Gantt chart of the
Concept Introduction: Gantt chart is a project management tool that is a type of bar chart. It depicts the project schedule and is used for resource allocation.
C.
Answer to Problem 26AP
A Gantt chart for the project has been drawn.
Explanation of Solution
Given information:
| Activity | Time |
| A | 4 |
| B | 2 |
| C | 3 |
| D | 1 |
| E | 1 |
| F | 2 |
| G | 3 |
| H | 1 |
| I | 5 |
| J | 3 |
| K | 4 |
| L | 2 |
| M | 1 |
Activity times and early start times:
| Activity | EST | Time |
| A | 0 | 4 |
| B | 4 | 2 |
| C | 6 | 3 |
| D | 9 | 1 |
| E | 10 | 1 |
| F | 6 | 2 |
| G | 8 | 3 |
| H | 11 | 1 |
| I | 6 | 5 |
| J | 11 | 3 |
| K | 11 | 4 |
| L | 15 | 2 |
| M | 17 | 1 |
The Gantt chart depicting the project based on the EST:
D.
Interpretation: The impact of replacement of the air compressor which takes two weeks on the completion of the project is to be determined.
Concept Introduction: Network diagram is a graphical representation of tasks and events happening in a project. It depicts the work flow and is used to compute the total duration of the project.
D.
Explanation of Solution
Given information:
| Activity | Time |
| A | 4 |
| B | 2 |
| C | 3 |
| D | 1 |
| E | 1 |
| F | 2 |
| G | 3 |
| H | 1 |
| I | 5 |
| J | 3 |
| K | 4 |
| L | 2 |
| M | 1 |
Installing the air compressor is represented by activity G.
| Activity | Time | EST | EFT | LST | LFT | Slack |
| A | 4 | 0 | 4 | 0 | 4 | 0 |
| B | 2 | 4 | 6 | 4 | 6 | 0 |
| C | 3 | 6 | 9 | 8 | 11 | 2 |
| D | 1 | 9 | 10 | 16 | 17 | 7 |
| E | 1 | 10 | 11 | 17 | 18 | 7 |
| F | 2 | 6 | 8 | 9 | 11 | 3 |
| G | 3 | 8 | 11 | 14 | 17 | 6 |
| H | 1 | 11 | 12 | 17 | 18 | 6 |
| I | 5 | 6 | 11 | 6 | 11 | 0 |
| J | 3 | 11 | 14 | 15 | 18 | 4 |
| K | 4 | 11 | 15 | 11 | 15 | 0 |
| L | 2 | 15 | 17 | 15 | 17 | 0 |
| M | 1 | 17 | 18 | 17 | 18 | 0 |
The latest start time of the activity G is 14th week. If the failure is identified before installation, the project will not be delayed as the replacement time (2 weeks) is less than the slack (6 weeks).
If the failure is found during testing of the air compressor, represented by activity H, still the project would not be delayed, as again there is a slack of 6 weeks.
E.
Interpretation: The activities that can be completed by the end of the 15th week without delaying the project completion are to be determined.
Concept Introduction: Network diagram is a graphical representation of tasks and events happening in a project. It depicts the work flow and is used to compute the total duration of the project.
E.
Answer to Problem 26AP
The activities A, B, C, F and I have to be completed by the end of the 15th week to guarantee project completion without delay.
Explanation of Solution
Given information:
| Activity | Time |
| A | 4 |
| B | 2 |
| C | 3 |
| D | 1 |
| E | 1 |
| F | 2 |
| G | 3 |
| H | 1 |
| I | 5 |
| J | 3 |
| K | 4 |
| L | 2 |
| M | 1 |
The table shows the Earliest and Latest times of the activities
| Activity | Time | EST | EFT | LST | LFT | Slack |
| A | 4 | 0 | 4 | 0 | 4 | 0 |
| B | 2 | 4 | 6 | 4 | 6 | 0 |
| C | 3 | 6 | 9 | 8 | 11 | 2 |
| D | 1 | 9 | 10 | 16 | 17 | 7 |
| E | 1 | 10 | 11 | 17 | 18 | 7 |
| F | 2 | 6 | 8 | 9 | 11 | 3 |
| G | 3 | 8 | 11 | 14 | 17 | 6 |
| H | 1 | 11 | 12 | 17 | 18 | 6 |
| I | 5 | 6 | 11 | 6 | 11 | 0 |
| J | 3 | 11 | 14 | 15 | 18 | 4 |
| K | 4 | 11 | 15 | 11 | 15 | 0 |
| L | 2 | 15 | 17 | 15 | 17 | 0 |
| M | 1 | 17 | 18 | 17 | 18 | 0 |
The latest finish times of the activities A, B, C, F and Iam less than 15 weeks. Therefore, these activities have to be completed by the end of the 15th weeks to guarantee project completion without any delay.
F.
Interpretation: The optimal solution for the problem is to be determined using linear programming.
Concept Introduction: Linear programming is a mathematical technique used to achieve the best outcome, given a list of parameters usually restrictions on the resources.
F.
Answer to Problem 26AP
The optimal solution for the problem is obtained using linear programming.
Explanation of Solution
Given information:
| Activity | Time |
| A | 4 |
| B | 2 |
| C | 3 |
| D | 1 |
| E | 1 |
| F | 2 |
| G | 3 |
| H | 1 |
| I | 5 |
| J | 3 |
| K | 4 |
| L | 2 |
| M | 1 |
The various paths of the project and the durations are:
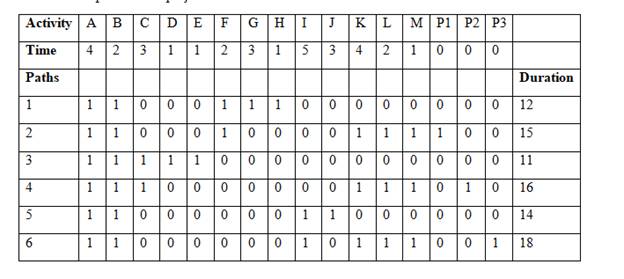
The critical path is A − B − I − K − L − M with the completion time of 18 weeks.
Using linear programming, the EST is calculated.
Objective function = =SUM (B2:M2)
| Nodes | 1 | 2 | 3 | 4 | 5 | 6 | 7 | 8 | 9 | 10 | 11 | 12 |
| EST |
The constraints
| Activity | Time | ||
| A | 0 | > | 4 |
| B | 0 | > | 2 |
| C | 0 | > | 3 |
| D | 0 | > | 1 |
| E | 0 | > | 1 |
| F | 0 | > | 2 |
| G | 0 | > | 3 |
| H | 0 | > | 1 |
| I | 0 | > | 5 |
| J | 0 | > | 3 |
| K | 0 | > | 4 |
| L | 0 | > | 2 |
| M | 0 | > | 1 |
| P1 | 0 | > | 0 |
| P2 | 0 | > | 0 |
| P3 | 0 | > | 0 |
Solver Solution:
| Objective Function |
| 120 |
EST for the nodes:
| Nodes | 1 | 2 | 3 | 4 | 5 | 6 | 7 | 8 | 9 | 10 | 11 | 12 |
| EST | 0 | 4 | 6 | 9 | 8 | 11 | 11 | 11 | 10 | 15 | 17 | 18 |
Want to see more full solutions like this?
Chapter 10 Solutions
EBK PRODUCTION AND OPERATIONS ANALYSIS


- There was a most recent poll for which 571 adults that flew in the past year had info collected. This info was their number 1 complaints about flying. A - small cramped seat - 45 complaints B - cost - 18 complaints C - fear or dislike - 81 complaints D - security - 123 complaints E - Poor service - 12 complaints F - Conntected flight issue - 8 complaints G - overcrowded - 41 complaints H - Late and wait - 81 complaints I - Food - 5 complaints J - Lost/missing luggage - 5 complaints K - Other - 51 complaints What percentage of those surveyed found nothing they didnt dislike?arrow_forwardCan you help me with this, and explain what a product by value analysis is? Thanks in advancearrow_forwardOperations Management Questionarrow_forward
- can you explain and breakdown the "ATB: digital disruption in the parking meter industry" case in detail outlining the key issuesarrow_forwardAt Quick Car Wash, the wash process is advertised to take less than 6 minutes. Consequently, management has set a target average of 330 seconds for the wash process. Suppose the average range for a sample of 7 cars is 10 seconds. Use the accompanying table to establish control limits for sample means and ranges for the car wash process. Click the icon to view the table of factors for calculating three-sigma limits for the x-chart and R-chart. The UCLR equals seconds and the LCLR equals seconds. (Enter your responses rounded to two decimal places.)arrow_forwardIf Jeremy who is the VP for the operations, proceeds with their existing prototype (which is option a), the firm can then expect sales to be 120,000 units at $550 each. And with a probability of 0.52 and a 0.48 probability of 65,000 at $550. we However, he uses his value analysis team (option b), the firm expects sales of 75,000 units at $770, with a probability of 0.78 and a 0.22 probability of 65,000 units at $770. Value engineering, at a cost of $100,000, is only used in option b. Which option for this has the highest expected monetary value (EMV)? The EMV for option a is $? The EMV for option b is $? Which has the highest expected monetary value. A or B?arrow_forward
- Part 1 of 2 Jim's Outfitters, Inc., makes custom western shirts. The shirts could be flawed in various ways, including flaws in the weave or color of the fabric, loose buttons or decorations, wrong dimensions, and uneven stitches. Jim randomly examined 10 shirts, with the following results shown to the right. Shirt Defects 1 7 2 1 4 13 3 10 2 8 5 9 10 8 7 a. Assuming that 10 observations are adequate for these purposes, determine the three-sigma control limits for defects per shirt. The UCLC equals and the LCL equals (Enter your responses rounded to two decimal places. If your answer for LCL is negative, enter this value as 0.)arrow_forwardManagement at Webster Chemical Company is concerned as to whether caulking tubes are being properly capped. If a significant proportion of the tubes are not being sealed, Webster is placing its customers in a messy situation. Tubes are packaged in large boxes of 144. Several boxes are inspected, and the following numbers of leaking tubes are found: Sample Tubes Sample Tubes Sample Tubes 1 7 8 7 15 7 2 7 9 8 16 9 3 6 10 7 17 3 4 4 11 1 18 7 5 8 12 8 19 7 6 7 2 9 13 14 1 20 6 7 Total 121 Calculate p-chart three-sigma control limits to assess whether the capping process is in statistical control. The UCLp equals and the LCLp equals (Enter your responses rounded to three decimal places. If your answer for LCLp is negative, enter this value as 0.)arrow_forwardAspen Plastics produces plastic bottles to customer order. The quality inspector randomly selects four bottles from the bottle machine and measures the outside diameter of the bottle neck, a critical quality dimension that determines whether the bottle cap will fit properly. The dimensions (in.) from the last six samples are Bottle Sample 1 2 3 4 1 0.624 0.586 0.602 0.591 2 0.613 0.599 0.578 0.618 3 0.606 0.585 0.587 0.623 4 0.581 0.623 0.571 0.610 5 0.609 0.610 0.623 0.617 6 0.605 0.573 0.570 0.602 Click the icon to view the table of factors for calculating three-sigma limits for the x-chart and R-chart. Suppose that the specification for the bottle neck diameter is 0.600 ± 0.050 in. and the population standard deviation is 0.014 in. a. What is the process capability index? The Cpk is (Enter your response rounded to two decimal places.)arrow_forward
- How would you handle the Apple 'batterygate' scandal as an operations manager? What quality measures would you take to fix the problem and prevent it from happening again? When would you implement these measures and communicate with the stakeholders?arrow_forwardPerosnal Thoughts about the articlearrow_forwardRevenue retrieval for Brew Mini= $ round response to two decimal places What would be the best design alternative? Brew master or brew miniarrow_forward
 Practical Management ScienceOperations ManagementISBN:9781337406659Author:WINSTON, Wayne L.Publisher:Cengage,
 Purchasing and Supply Chain ManagementOperations ManagementISBN:9781285869681Author:Robert M. Monczka, Robert B. Handfield, Larry C. Giunipero, James L. PattersonPublisher:Cengage Learning