
Concept explainers
Videos
A.
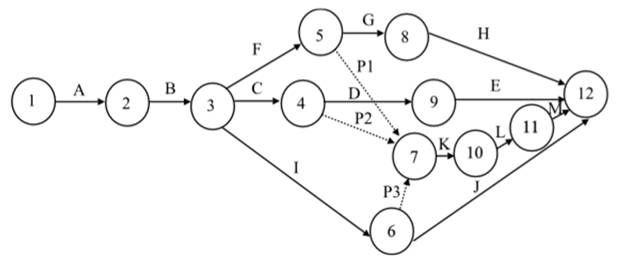
Interpretation: A network diagram representing the activities of the project is to be constructed.
Concept Introduction: Network diagram is a graphical representation of tasks and events happening in a project. It depicts the work flow and is used to compute the total duration of the project.
A.
Explanation of Solution
Given information: Theactivities to be taken up for the construction of a gas station and the time duration for each are given in the table.
| Activity | Time |
| A | 4 |
| B | 2 |
| C | 3 |
| D | 1 |
| E | 1 |
| F | 2 |
| G | 3 |
| H | 1 |
| I | 5 |
| J | 3 |
| K | 4 |
| L | 2 |
| M | 1 |
The activity times and the precedence relationship are shown in the table:
| Activity | Time | Predecessors |
| A | 4 | |
| B | 2 | A |
| C | 3 | B |
| D | 1 | C |
| E | 1 | D |
| F | 2 | B |
| G | 3 | F |
| H | 1 | G |
| I | 5 | B |
| J | 3 | I |
| K | 4 | C, F, I |
| L | 2 | K |
| M | 1 | L |
The network diagram showing the work flows is as follows:
B.
Interpretation: The critical path is to be identified by computing the earliest and the latest start and finish times.
Concept Introduction: Network diagram is a graphical representation of tasks and events happening in a project. It depicts the work flow and is used to compute the total duration of the project.
B.
Answer to Problem 26AP
The critical path is A − B − I − K − L − M with completion time as 18 weeks
Explanation of Solution
Given information:
| Activity | Time |
| A | 4 |
| B | 2 |
| C | 3 |
| D | 1 |
| E | 1 |
| F | 2 |
| G | 3 |
| H | 1 |
| I | 5 |
| J | 3 |
| K | 4 |
| L | 2 |
| M | 1 |

The earliest and latest start and finish times are calculated using the formulae:
Earliest Start (EST) = Maximum EFT of the predecessor activity
Latest Start (LST) = LFT - Duration
Earliest Finish (EFT) = EST + Duration
Latest Finish (LFT) = Minimum LST of the immediate successor
Slack = LFT − EFT (or) LST − EST
| Activity | Time | EST | EFT | LST | LFT | Slack |
| A | 4 | 0 | 4 | 0 | 4 | 0 |
| B | 2 | 4 | 6 | 4 | 6 | 0 |
| C | 3 | 6 | 9 | 8 | 11 | 2 |
| D | 1 | 9 | 10 | 16 | 17 | 7 |
| E | 1 | 10 | 11 | 17 | 18 | 7 |
| F | 2 | 6 | 8 | 9 | 11 | 3 |
| G | 3 | 8 | 11 | 14 | 17 | 6 |
| H | 1 | 11 | 12 | 17 | 18 | 6 |
| I | 5 | 6 | 11 | 6 | 11 | 0 |
| J | 3 | 11 | 14 | 15 | 18 | 4 |
| K | 4 | 11 | 15 | 11 | 15 | 0 |
| L | 2 | 15 | 17 | 15 | 17 | 0 |
| M | 1 | 17 | 18 | 17 | 18 | 0 |
The critical path includes the activities with zero slack. So, here the critical path is A − B− I − K − L − M. The total time taken to complete the project is 18 weeks.
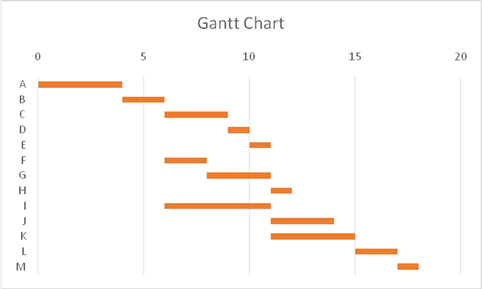
C.
Interpretation: A Gantt chart of the
Concept Introduction: Gantt chart is a project management tool that is a type of bar chart. It depicts the project schedule and is used for resource allocation.
C.
Answer to Problem 26AP
A Gantt chart for the project has been drawn.
Explanation of Solution
Given information:
| Activity | Time |
| A | 4 |
| B | 2 |
| C | 3 |
| D | 1 |
| E | 1 |
| F | 2 |
| G | 3 |
| H | 1 |
| I | 5 |
| J | 3 |
| K | 4 |
| L | 2 |
| M | 1 |
Activity times and early start times:
| Activity | EST | Time |
| A | 0 | 4 |
| B | 4 | 2 |
| C | 6 | 3 |
| D | 9 | 1 |
| E | 10 | 1 |
| F | 6 | 2 |
| G | 8 | 3 |
| H | 11 | 1 |
| I | 6 | 5 |
| J | 11 | 3 |
| K | 11 | 4 |
| L | 15 | 2 |
| M | 17 | 1 |
The Gantt chart depicting the project based on the EST:
D.
Interpretation: The impact of replacement of the air compressor which takes two weeks on the completion of the project is to be determined.
Concept Introduction: Network diagram is a graphical representation of tasks and events happening in a project. It depicts the work flow and is used to compute the total duration of the project.
D.
Explanation of Solution
Given information:
| Activity | Time |
| A | 4 |
| B | 2 |
| C | 3 |
| D | 1 |
| E | 1 |
| F | 2 |
| G | 3 |
| H | 1 |
| I | 5 |
| J | 3 |
| K | 4 |
| L | 2 |
| M | 1 |
Installing the air compressor is represented by activity G.
| Activity | Time | EST | EFT | LST | LFT | Slack |
| A | 4 | 0 | 4 | 0 | 4 | 0 |
| B | 2 | 4 | 6 | 4 | 6 | 0 |
| C | 3 | 6 | 9 | 8 | 11 | 2 |
| D | 1 | 9 | 10 | 16 | 17 | 7 |
| E | 1 | 10 | 11 | 17 | 18 | 7 |
| F | 2 | 6 | 8 | 9 | 11 | 3 |
| G | 3 | 8 | 11 | 14 | 17 | 6 |
| H | 1 | 11 | 12 | 17 | 18 | 6 |
| I | 5 | 6 | 11 | 6 | 11 | 0 |
| J | 3 | 11 | 14 | 15 | 18 | 4 |
| K | 4 | 11 | 15 | 11 | 15 | 0 |
| L | 2 | 15 | 17 | 15 | 17 | 0 |
| M | 1 | 17 | 18 | 17 | 18 | 0 |
The latest start time of the activity G is 14th week. If the failure is identified before installation, the project will not be delayed as the replacement time (2 weeks) is less than the slack (6 weeks).
If the failure is found during testing of the air compressor, represented by activity H, still the project would not be delayed, as again there is a slack of 6 weeks.
E.
Interpretation: The activities that can be completed by the end of the 15th week without delaying the project completion are to be determined.
Concept Introduction: Network diagram is a graphical representation of tasks and events happening in a project. It depicts the work flow and is used to compute the total duration of the project.
E.
Answer to Problem 26AP
The activities A, B, C, F and I have to be completed by the end of the 15th week to guarantee project completion without delay.
Explanation of Solution
Given information:
| Activity | Time |
| A | 4 |
| B | 2 |
| C | 3 |
| D | 1 |
| E | 1 |
| F | 2 |
| G | 3 |
| H | 1 |
| I | 5 |
| J | 3 |
| K | 4 |
| L | 2 |
| M | 1 |
The table shows the Earliest and Latest times of the activities
| Activity | Time | EST | EFT | LST | LFT | Slack |
| A | 4 | 0 | 4 | 0 | 4 | 0 |
| B | 2 | 4 | 6 | 4 | 6 | 0 |
| C | 3 | 6 | 9 | 8 | 11 | 2 |
| D | 1 | 9 | 10 | 16 | 17 | 7 |
| E | 1 | 10 | 11 | 17 | 18 | 7 |
| F | 2 | 6 | 8 | 9 | 11 | 3 |
| G | 3 | 8 | 11 | 14 | 17 | 6 |
| H | 1 | 11 | 12 | 17 | 18 | 6 |
| I | 5 | 6 | 11 | 6 | 11 | 0 |
| J | 3 | 11 | 14 | 15 | 18 | 4 |
| K | 4 | 11 | 15 | 11 | 15 | 0 |
| L | 2 | 15 | 17 | 15 | 17 | 0 |
| M | 1 | 17 | 18 | 17 | 18 | 0 |
The latest finish times of the activities A, B, C, F and Iam less than 15 weeks. Therefore, these activities have to be completed by the end of the 15th weeks to guarantee project completion without any delay.
F.
Interpretation: The optimal solution for the problem is to be determined using linear programming.
Concept Introduction: Linear programming is a mathematical technique used to achieve the best outcome, given a list of parameters usually restrictions on the resources.
F.
Answer to Problem 26AP
The optimal solution for the problem is obtained using linear programming.
Explanation of Solution
Given information:
| Activity | Time |
| A | 4 |
| B | 2 |
| C | 3 |
| D | 1 |
| E | 1 |
| F | 2 |
| G | 3 |
| H | 1 |
| I | 5 |
| J | 3 |
| K | 4 |
| L | 2 |
| M | 1 |
The various paths of the project and the durations are:
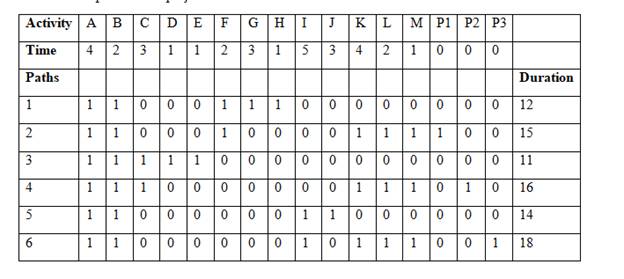
The critical path is A − B − I − K − L − M with the completion time of 18 weeks.
Using linear programming, the EST is calculated.
Objective function = =SUM (B2:M2)
| Nodes | 1 | 2 | 3 | 4 | 5 | 6 | 7 | 8 | 9 | 10 | 11 | 12 |
| EST |
The constraints
| Activity | Time | ||
| A | 0 | > | 4 |
| B | 0 | > | 2 |
| C | 0 | > | 3 |
| D | 0 | > | 1 |
| E | 0 | > | 1 |
| F | 0 | > | 2 |
| G | 0 | > | 3 |
| H | 0 | > | 1 |
| I | 0 | > | 5 |
| J | 0 | > | 3 |
| K | 0 | > | 4 |
| L | 0 | > | 2 |
| M | 0 | > | 1 |
| P1 | 0 | > | 0 |
| P2 | 0 | > | 0 |
| P3 | 0 | > | 0 |
Solver Solution:
| Objective Function |
| 120 |
EST for the nodes:
| Nodes | 1 | 2 | 3 | 4 | 5 | 6 | 7 | 8 | 9 | 10 | 11 | 12 |
| EST | 0 | 4 | 6 | 9 | 8 | 11 | 11 | 11 | 10 | 15 | 17 | 18 |
Want to see more full solutions like this?
Chapter 10 Solutions
Production and Operations Analysis, Seventh Edition


- Women who ask for what they want in negotiation are less well-liked than women who do not self-advocate. However, nonassertive, other-advocating women suffer a leadership backlash and are regarded as less competent because their behavior is regarded to be _____ and _____. A. high-negative feminine; low-positive masculine B. high-positive feminine; high-positive masculine C. high-negative masculine; low-negative feminine D. low-positive masculine; low-positive femininearrow_forwardThere are five most recognized personality traits that can reliably be measured and predict negotiator behavior in a number of different situations. All of the following are one of those "Big 5" personality traits except _____. A. conscientiousness B. introversion C. agreeableness D. openness to experiencearrow_forwardWith regard to reputation in negotiation, negotiators who use adversarial, stubborn, and ethically questionable behavior often have the effect of _____. A. improving their business relationships B. decreasing their effectiveness as a negotiator C. improving their business relationships D. decreasing their group statusarrow_forward
- When it comes to assertiveness, there is only a modest link between negotiators' self-views and how the counterparty sees them. Many negotiators come away from a negotiation thinking they came on too strong with the counterparty. The _____ refers to the fact that negotiators believe they are coming on too strong with the counterparty, but they actually are not. A. Collective trap illusion B. Attribution error C. Aggressive anchoring bias D. Line-crossing illusionarrow_forwardAs you think about the issue of using chatbots in contract negotiations, consider whether other facets and concepts of negotiations that we have discussed and whether they would be adequately addressed.arrow_forwardWhile I am not a fan of AI as of yet, I do understand the endless possibilities. Based on the research, it is clear that AI has great potential for negotiation (Yang, 2025). Herold et al. (2025) suggested that AI can flag potential risks and liabilities, allowing negotiators to address them and mitigate potential problems proactively. AI can draft new contract templates by examining industry standards and past contracts, and AI technology can help lawyers spot errors and inconsistencies in contract drafts. In relation to risk management, AI can flag possible risks and liabilities, allowing negotiators to proactively address them and lessen potential problems, which can speed up the negotiation process, making the negotiation efficient because AI can industrialize tasks like document review, redlining, and finding potential issues, significantly reducing negotiation time. Lastly, AI can analyze vast amounts of data and identify errors, inconsistencies, and irregularities in…arrow_forward
- What is a main thought on using AI in contract negotiations?arrow_forwardWhat are some people thoughts on using AI in contract negotiations?arrow_forward3. Develop a high-level or summary: a. Risk Management Plan Focus on specific, actionable steps for each risk and mitigation strategy.Provide detailed timelines for procurement, stakeholder engagement, and risk monitoring.Avoid over-simplifying and add more technical details in areas like quality assurance and financial control measures. Add a risk prioritization method and mention how risks will be monitored and reviewed throughout the project lifecycle. Overall, it is well organized andc overs key risks.arrow_forward
- 3. Develop a high-level or summary: Human Resource Management Plan Provide more concrete timelines and actionable steps for human resource management.Include more detailed risk management strategies and link them more explicitly to the overall project plan.Expand on how training and development will be evaluated and tracked.Also, the overall length is good, but some sections could be condensed by eliminating repetition (e.g., you discuss stakeholder communication and engagement in two sections without adding new information).Try not to repeat the same risk management ideas (e.g., resource sharing and stakeholder concerns) in multiple sections without adding value.arrow_forwardBased on the U.S. Department of Transporation's publication on the number of inrternatioal passengers that come through New York airport (JFK) in 2012, how would I estimate the passenger volume for the coming year?arrow_forwardWhat are the role of trends and seasonality based on the Department of Transportation publication of the number of international passengers that come through New York (JFK) in 2012?arrow_forward
 Practical Management ScienceOperations ManagementISBN:9781337406659Author:WINSTON, Wayne L.Publisher:Cengage,
 Purchasing and Supply Chain ManagementOperations ManagementISBN:9781285869681Author:Robert M. Monczka, Robert B. Handfield, Larry C. Giunipero, James L. PattersonPublisher:Cengage Learning