
Concept explainers
Videos
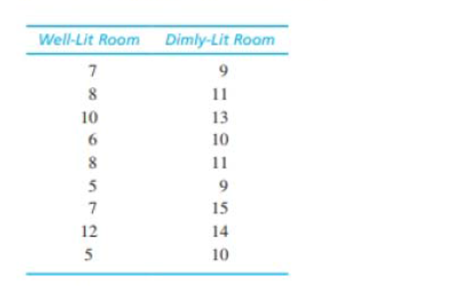
Research has shown that people are more likely to show dishonest and self-interested behaviors in darkness than in a well-lit environment (Zhong, Bohns, & Gina, 2010). In one experiment, participants were given a set of 20 puzzles and were paid $0.50 for each one solved in a 5-minute period. However, the participants reported their own performance and there was no obvious method for checking their honesty. Thus, the task provided a clear opportunity to cheat and receive undeserved money. One group of participants was tested in a room with dimmed lighting and a second group was tested in a well-lit room. The reported number of solved puzzles was recorded for each individual. The following data represent results similar to those obtained in the study.
a. Is there a significant difference in reported performance between the two conditions? Use a two-tailed test with
b. Compute Cohen's d to estimate the size of the treatment effect.
a.
To check: Whether there is significant difference in reported performance between the two conditions using two-tailed test with
Answer to Problem 24P
Reject null and conclude that there is significant difference in reported performance between the two conditions
Explanation of Solution
Given info:
Two samples each of size 9 is given in the question. Two-tailed hypothesis test using
Calculations:
Step 1: Null Hypothesis is
Step 2: For the given sample, the t-statistics will have degrees of freedom equals:
For a two-tailed test with
Step 3: The t-statistics is calculated using formula:
Software procedure:
Step-by-step procedure to obtain the sample mean and variance for the two groups, using the SPSS software:
- Go to Variable View> Enter the name of the variable as Money and Paper.
- Go to Data View>Enter the values ofMoney and Paper.
- Choose Analyze > Descriptive Statistics> choose Descriptive.
- Select Money and Paper and move it under variable(s)> Choose Options> Select Mean , Std. Deviation and Variance
- ChooseContinue> choose OK.
Output using the SPSS software is given below:
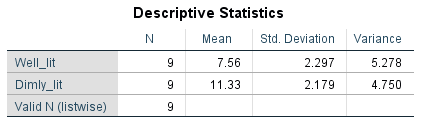
From the SPSS output, the value of sample means, and variances are:
Next, calculate pooled variance,
Substitute 5.27 for
Now, the formula for estimated standard error of the difference is
Substitute 5.01 for
Finally, substitute 1.055 for
Step 4: Rejection rule: Reject when
Since
Step 5: Based on the results of hypothesis test, there is sufficient evidence to reject the null hypothesis.
Hence, reject null and conclude that there is significant difference in reported performance between the two conditions
b.
To Find: The value of Cohen’s d for the given question.
Answer to Problem 24P
The value of Cohen’s d is 1.69.
Explanation of Solution
Given info:
Two samples each of size 9 is given in the question. The sample means, and pooled variance were calculated in the part (a) of the question.
Calculations:
The formula for Cohen’s d is:
Substitute 5.01 for
Hence, Cohen’s d is 1.69.
Want to see more full solutions like this?
Chapter 10 Solutions
Essentials of Statistics for the Behavioral Sciences


- 9. The concentration function of a random variable X is defined as Qx(h) = sup P(x ≤ X ≤x+h), h>0. Show that, if X and Y are independent random variables, then Qx+y (h) min{Qx(h). Qr (h)).arrow_forward10. Prove that, if (t)=1+0(12) as asf->> O is a characteristic function, then p = 1.arrow_forward9. The concentration function of a random variable X is defined as Qx(h) sup P(x ≤x≤x+h), h>0. (b) Is it true that Qx(ah) =aQx (h)?arrow_forward
- 3. Let X1, X2,..., X, be independent, Exp(1)-distributed random variables, and set V₁₁ = max Xk and W₁ = X₁+x+x+ Isk≤narrow_forward7. Consider the function (t)=(1+|t|)e, ER. (a) Prove that is a characteristic function. (b) Prove that the corresponding distribution is absolutely continuous. (c) Prove, departing from itself, that the distribution has finite mean and variance. (d) Prove, without computation, that the mean equals 0. (e) Compute the density.arrow_forward1. Show, by using characteristic, or moment generating functions, that if fx(x) = ½ex, -∞0 < x < ∞, then XY₁ - Y2, where Y₁ and Y2 are independent, exponentially distributed random variables.arrow_forward
- 1. Show, by using characteristic, or moment generating functions, that if 1 fx(x): x) = ½exarrow_forward1990) 02-02 50% mesob berceus +7 What's the probability of getting more than 1 head on 10 flips of a fair coin?arrow_forward9. The concentration function of a random variable X is defined as Qx(h) sup P(x≤x≤x+h), h>0. = x (a) Show that Qx+b(h) = Qx(h).arrow_forward
- Suppose that you buy a lottery ticket, and you have to pick six numbers from 1 through 50 (repetitions allowed). Which combination is more likely to win: 13, 48, 17, 22, 6, 39 or 1, 2, 3, 4, 5, 6? barrow_forward2 Make a histogram from this data set of test scores: 72, 79, 81, 80, 63, 62, 89, 99, 50, 78, 87, 97, 55, 69, 97, 87, 88, 99, 76, 78, 65, 77, 88, 90, and 81. Would a pie chart be appropriate for this data? ganizing Quantitative Data: Charts and Graphs 45arrow_forward10 Meteorologists use computer models to predict when and where a hurricane will hit shore. Suppose they predict that hurricane Stat has a 20 percent chance of hitting the East Coast. a. On what info are the meteorologists basing this prediction? b. Why is this prediction harder to make than your chance of getting a head on your next coin toss? U anoiaarrow_forward
 Glencoe Algebra 1, Student Edition, 9780079039897...AlgebraISBN:9780079039897Author:CarterPublisher:McGraw Hill
 College Algebra (MindTap Course List)AlgebraISBN:9781305652231Author:R. David Gustafson, Jeff HughesPublisher:Cengage Learning
 Holt Mcdougal Larson Pre-algebra: Student Edition...AlgebraISBN:9780547587776Author:HOLT MCDOUGALPublisher:HOLT MCDOUGAL
 Algebra & Trigonometry with Analytic GeometryAlgebraISBN:9781133382119Author:SwokowskiPublisher:Cengage