
Identify the effect of the events on the quantity of real
Explanation of Solution
- The U.S firm move their call handling, IT, and data function to Country I:
A movement of call handling, IT, and data function from the U.D firm to Country I’s firm will cause an expansion of a business. In order to expand the business of the firm, it will result in demanding new capital, increase employment, and production. Therefore, the quantity of real GDP supplies and aggregate supply will increase.
Figure -1 shows the effect of movement of business from one firm to other firms as follows:

In Figure -1, the horizontal axis measures real GDP and the vertical axis measures
In Figure -1, the curve short-run aggregate supply (SAS), long-run
- Fuel price rise:
A rise in fuel price will result in an increase in the price level, which will rise the cost of production and temporarily decrease the aggregate supply. This will cause the short-run supply shift to the leftward direction and long-run aggregate supply curve remain unchanged.
Figure -2 shows the impact of rising in fuel price as follows:

In Figure -2, the horizontal axis measures real GDP and the vertical axis measures price level.
In Figure -2, point E represents the initial equilibrium of the economy. Since as the rise in price cause a temporary decrease in short-run aggregate supply, which result in short-run aggregate supply curve shift to the leftward direction. Therefore, point E1 represents the new equilibrium point and SAS1 is the new short-run aggregate supply curve.
- Walmart and Starbucks open in Country I:
The Walmart and Starbucks open in Country I, which causes an expansion of their business. In order to expend the business of the firm, which will result in demanding new capital, increased employment, and production. Therefore, the quantity of real GDP supplies and aggregate supply will increase.
Figure -3 shows the effect of the expansion of business from one country to another country as follows:
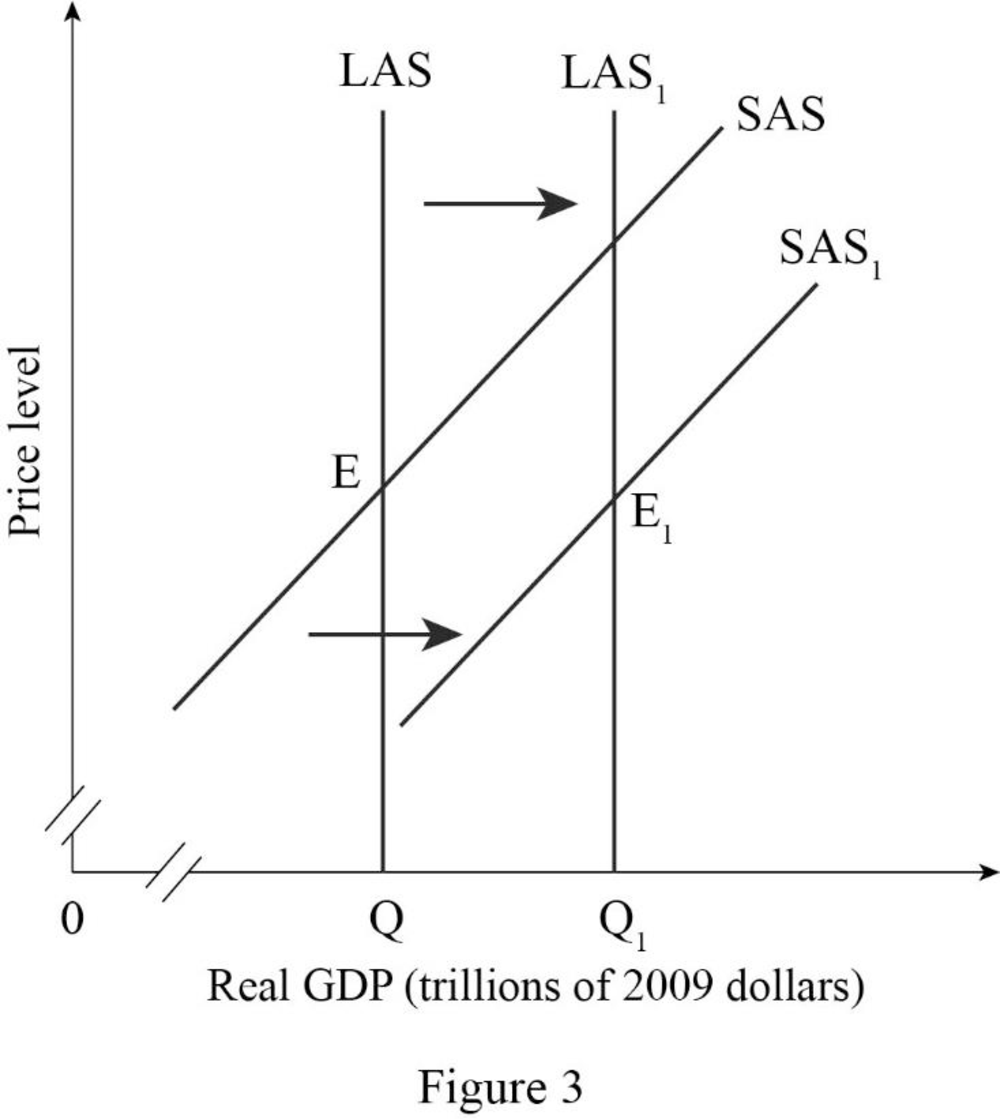
In Figure -3, the horizontal axis measures real GDP and the vertical axis measures price level.
In Figure -3, the curve short-run aggregate supply (SAS), long-run aggregate supply curve (LAS) at output Q represents the initial outcome of the economy. The result of the expansion of a business into one country to another country will cause an increase in long-run aggregate supply and short run aggregate supply and will result in a long-run aggregate supply curve (LAS1) and short-run aggregate supply curve (SAS1) shift to the rightward direction.
- Universities in the Country I increase the number of engineering graduates.
An increase in the number of engineering graduates in Country I will result in an increase in human capital and opportunity of employment expansion. Therefore, the quantity of real GDP supplies and aggregate supply will increase.
Figure -4 shows the effect of expansion of business from one country to another country as follows:

In Figure -4, the horizontal axis measures real GDP and the vertical axis measures price level.
In Figure -4, the curve short-run aggregate supply (SAS), long-run aggregate supply curve (LAS) at output Q represents the initial outcome of the economy. The result of an increase in the human capital and employment opportunity will cause an increase in long-run aggregate supply and short-run aggregate supply, which will result in a long-run aggregate supply curve (LAS1) and short-run aggregate supply curve (SAS1) shift to the rightward direction.
- The money wage rate rises:
An increase in the money wage rate causes an increase in the cost of production of the firm because with the existing employment rate, the firm will pay a high salary or wage for the same quantity of output. Therefore, there occur a temporarily decrease in the aggregate supply, which will cause the short-run supply to shift to the leftward direction and long-run aggregate supply curve remain unchanged.
Figure -5 shows the effect of a rise in the money wage rate as follows:
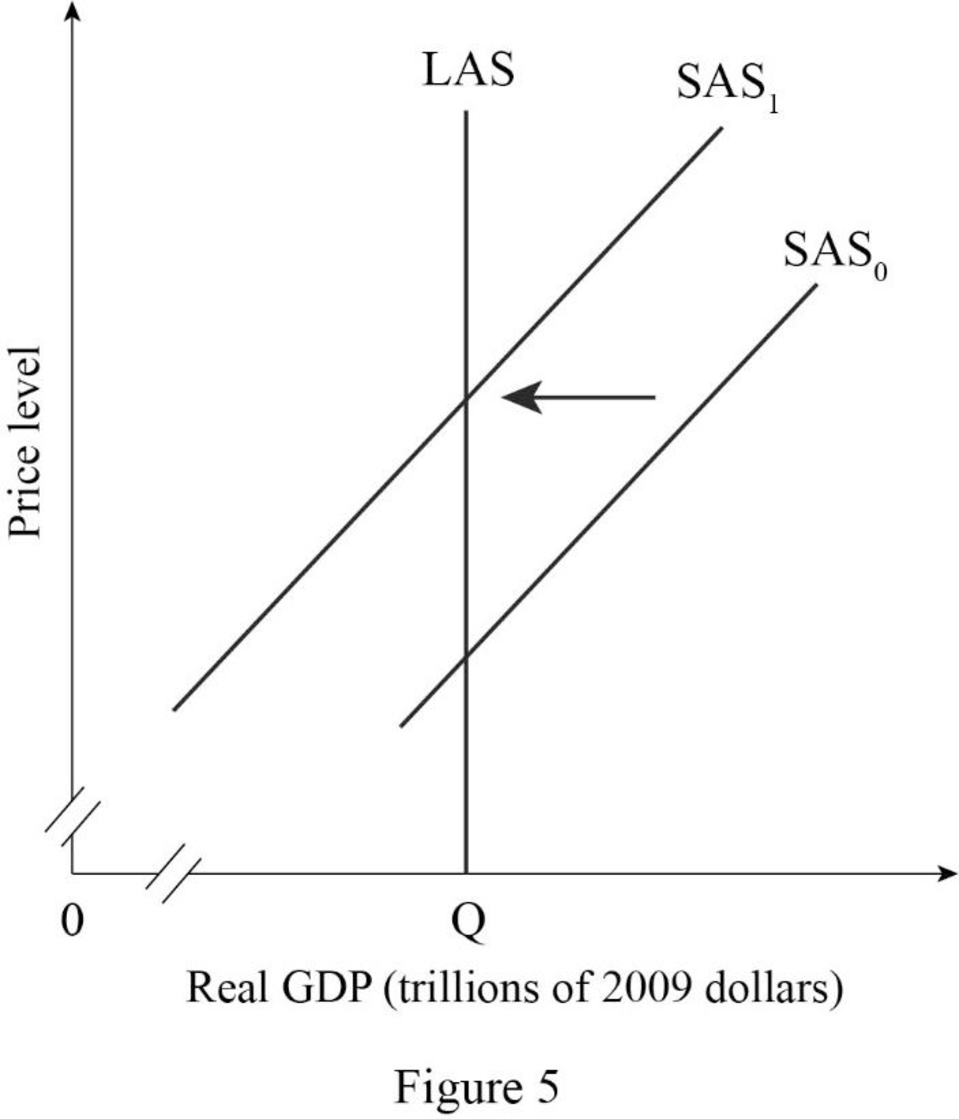
In Figure -5, the horizontal axis measures real GDP and the vertical axis measures price level.
In Figure -5, point E represents the initial equilibrium of the economy. Since as a rise in money wage rate causes a temporary decrease in short-run aggregate supply, which results in short-run aggregate supply curve shift to the leftward direction. Therefore, point E1 represents new equilibrium point and SAS1 is the new short-run aggregate supply curve.
- The price level in Country I increases:
In the short-run, an increase in the price level in the Country I cause an increase in the quantity supply of real GDP. Since an increase in price level causes an increase in the money wage rate, hence, in the long run, there occur an upward movement or real GDP along with long-run aggregate supply curve.
Figure -6 shows the impact of rise in the price level in Country I as follows:
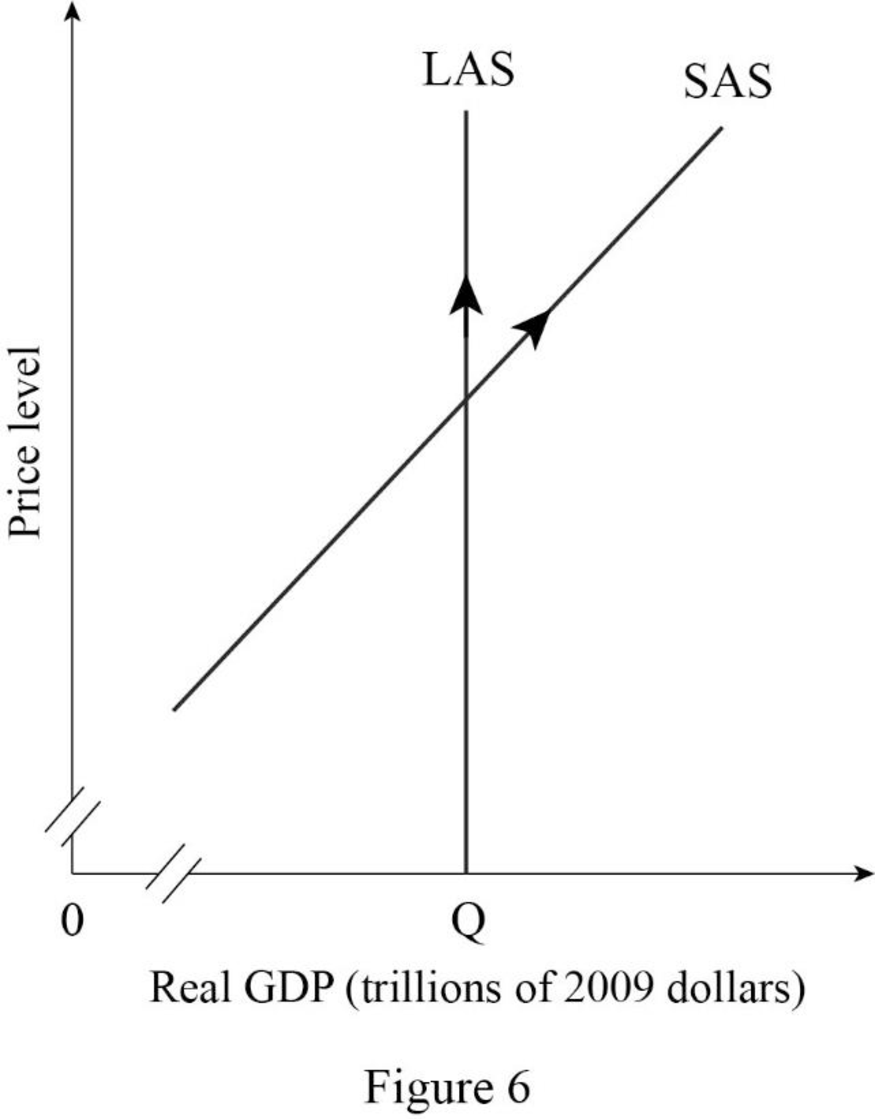
In Figure -6, the horizontal axis measures real GDP and the vertical axis measures price level.
In Figure -6, a rising in the price level causes a rise in money wage rate, hence in the long-run, the quantity supplied of real GDP increases. Therefore, there occurs an upward movement along with the long-run aggregate supply curve and the short-run aggregate supply curve.
Want to see more full solutions like this?
Chapter 10 Solutions
EBK MACROECONOMICS

- 1. Imagine a society that produces military goods and consumer goods, which we'll call "guns" and "butter." a. Draw a production possibilities frontier for guns and butter. Using the concept of opportunity cost, explain why it most likely has a bowed-out shape. b. Show a point that is impossible for the economy to achieve. Show a point that is feasible but inefficient. c. Imagine that the society has two political parties, called the Hawks (who want a strong military) and the Doves (who want a smaller military). Show a point on your production possibilities frontier that the Hawks might choose and a point the Doves might choose. d. Imagine that an aggressive neighboring country reduces the size of its military. As a result, both the Hawks and the Doves reduce their desired production of guns by the same amount. Which party would get the bigger "peace dividend," measured by the increase in butter production? Explain.arrow_forwardA health study tracked a group of persons for five years. At the beginning of the study, 20%were classified as heavy smokers, 30% as light smokers, and 50% as nonsmokers. Resultsof the study showed that light smokers were twice as likely as nonsmokers to die duringthe five-year study, but only half as likely as heavy smokers.A randomly selected participant from the study died during the five-year period. Calculatethe probability that the participant was a heavy smokerarrow_forwardConsider two assets with the following returns: State Prob. of state R₁ R2 1 23 13 25% 5% 2 -10% 1% Compute the optimal portfolio for an investor having a Bernoulli utility of net returns u(r) = 2√√r+ 10. Compute the certainty equivalent of the optimal portfolio. Do the results change if short-selling is not allowed? If so, how?arrow_forward
- In the graph at the right, the average variable cost is curve ☐. The average total cost is curve marginal cost is curve The C Cost per Unit ($) Per Unit Costs A 0 Output Quantity Barrow_forwardWhat are some of the question s that I can ask my economic teacher?arrow_forwardAnswer question 2 only.arrow_forward
- 1. A pension fund manager is considering three mutual funds. The first is a stock fund, the second is a long-term government and corporate fund, and the third is a (riskless) T-bill money market fund that yields a rate of 8%. The probability distributions of the risky funds have the following characteristics: Standard Deviation (%) Expected return (%) Stock fund (Rs) 20 30 Bond fund (RB) 12 15 The correlation between the fund returns is .10.arrow_forwardFrederick Jones operates a sole proprietorship business in Trinidad and Tobago. His gross annual revenue in 2023 was $2,000,000. He wants to register for VAT, but he is unsure of what VAT entails, the requirements for registration and what he needs to do to ensure that he is fully compliant with VAT regulations. Make reference to the Vat Act of Trinidad and Tobago and explain to Mr. Jones what VAT entails, the requirements for registration and the requirements to be fully compliant with VAT regulations.arrow_forwardCan you show me the answers for parts a and b? Thanks.arrow_forward
- What are the answers for parts a and b? Thanksarrow_forwardWhat are the answers for a,b,c,d? Are they supposed to be numerical answers or in terms of a variable?arrow_forwardSue is a sole proprietor of her own sewing business. Revenues are $150,000 per year and raw material (cloth, thread) costs are $130,000 per year. Sue pays herself a salary of $60,000 per year but gave up a job with a salary of $80,000 to run the business. ○ A. Her accounting profits are $0. Her economic profits are - $60,000. ○ B. Her accounting profits are $0. Her economic profits are - $40,000. ○ C. Her accounting profits are - $40,000. Her economic profits are - $60,000. ○ D. Her accounting profits are - $60,000. Her economic profits are -$40,000.arrow_forward

 Macroeconomics: Private and Public Choice (MindTa...EconomicsISBN:9781305506756Author:James D. Gwartney, Richard L. Stroup, Russell S. Sobel, David A. MacphersonPublisher:Cengage Learning
 Economics: Private and Public Choice (MindTap Cou...EconomicsISBN:9781305506725Author:James D. Gwartney, Richard L. Stroup, Russell S. Sobel, David A. MacphersonPublisher:Cengage Learning
 Exploring EconomicsEconomicsISBN:9781544336329Author:Robert L. SextonPublisher:SAGE Publications, Inc
 Economics (MindTap Course List)EconomicsISBN:9781337617383Author:Roger A. ArnoldPublisher:Cengage Learning