
Concept explainers
Videos
NASDAQ 100 Stocks For Exercises 1-10, the data come from a random sample of 20 companies of the NASDAQ 100 taken on June 8, 2017. (Data from: www.morningstar.com.)
For Exercises 1 and 2, (a) write a frequency distribution; (b) draw a histogram.
The variable is the price of the stock (rounded to the nearest dollar).
| 123 | 35 | 76 | 38 |
| 45 | 62 | 50 | 111 |
| 180 | 108 | 65 | 46 |
| 66 | 100 | 64 | 144 |
| 57 | 107 | 48 | 110 |
(a)
Explanation of Solution
Given:
Consider the data came from a random sample of 20 companies of NASDAQ 100
| 123 | 35 | 76 | 38 |
| 45 | 62 | 50 | 111 |
| 180 | 108 | 65 | 46 |
| 66 | 100 | 64 | 144 |
| 57 | 107 | 48 | 110 |
Calculation:
To draw the frequency table, sort the data set
35,38,45, 46,48,50,57,62,64,65,66,76,100,107,108,110,111,123,144,180
There is no repetition of data therefore the frequency of occurrence is 1 for all the data set hence the frequency distribution is
| 35 | 1 | 66 | 1 |
| 38 | 1 | 76 | 1 |
| 45 | 1 | 100 | 1 |
| 46 | 1 | 107 | 1 |
| 48 | 1 | 108 | 1 |
| 50 | 1 | 110 | 1 |
| 57 | 1 | 111 | 1 |
| 62 | 1 | 123 | 1 |
| 64 | 1 | 144 | 1 |
| 65 | 1 | 180 | 1 |
(b)
To graph: Draw the histogram corresponding to the corresponding to the data came from a random sample of 20 companies of NASDAQ 100.
Explanation of Solution
Given:
Consider the data came from a random sample of 20 companies of NASDAQ 100
| 123 | 35 | 76 | 38 |
| 45 | 62 | 50 | 111 |
| 180 | 108 | 65 | 46 |
| 66 | 100 | 64 | 144 |
| 57 | 107 | 48 | 110 |
Calculation:
To draw the frequency table sort the data set
35,38,45, 46,48,50,57,62,64,65,66,76,100,107,108,110,111,123,144,180
There is no repetition of data therefore the frequency of occurrence is 1 for all the data set hence the frequency distribution is
| 35 | 1 | 66 | 1 |
| 38 | 1 | 76 | 1 |
| 45 | 1 | 100 | 1 |
| 46 | 1 | 107 | 1 |
| 48 | 1 | 108 | 1 |
| 50 | 1 | 110 | 1 |
| 57 | 1 | 111 | 1 |
| 62 | 1 | 123 | 1 |
| 64 | 1 | 144 | 1 |
| 65 | 1 | 180 | 1 |
| Range | Frequency |
| 20-40 | 2 |
| 40-60 | 5 |
| 60-80 | 5 |
| 80-100 | 0 |
| 100-120 | 5 |
| 120-140 | 1 |
| 140-160 | 1 |
| 160-180 | 0 |
| 180-200 | 1 |
The y-axis represents frequency with a scale of
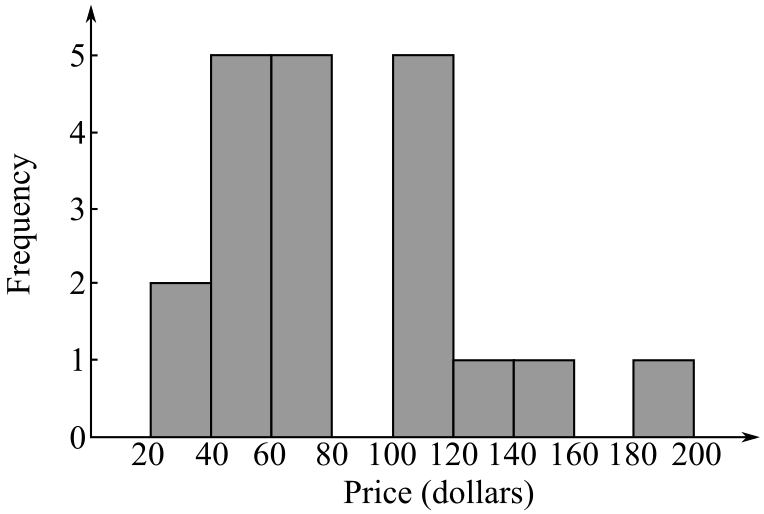
Hence, the histogram corresponding to the corresponding to the data came from a random sample of 20 companies of NASDAQ 100 is drawn.
Want to see more full solutions like this?
Chapter 10 Solutions
MATHEMATICS WITH APPL....-ACCESS


- Number 17 pleasearrow_forwardFind area of the secarrow_forwardConsider the linear system whose augmented matrix is [1 1 1 1 1] 1 2 3 4 5 Identify which variables are basic and which variables are free, and then give the general solution of this system by expressing the basic variables in terms of the free variables. Show all of your work.arrow_forward
- -0-3-0-8 10 = = 5 Determine if w can be written as a linear combination of V1, V2, and v3. Show all of your work and justify your conclusions.arrow_forwardQ1.2 1 Point Which of the following best describes Span O a point two points a line O a plane O all of R³ Save Answer Q1.3 1 Point Which of the following best describes Span O a point two points a line O a plane O all of R³ Save Answer Q1.4 1 Point Which of the following best describes Span O a point O three points a line O a plane O all of R³ Save Answerarrow_forwardi need help pleasearrow_forward
 Holt Mcdougal Larson Pre-algebra: Student Edition...AlgebraISBN:9780547587776Author:HOLT MCDOUGALPublisher:HOLT MCDOUGAL
 Glencoe Algebra 1, Student Edition, 9780079039897...AlgebraISBN:9780079039897Author:CarterPublisher:McGraw Hill
 Big Ideas Math A Bridge To Success Algebra 1: Stu...AlgebraISBN:9781680331141Author:HOUGHTON MIFFLIN HARCOURTPublisher:Houghton Mifflin Harcourt