Concept explainers
NASDAQ 100 Stocks For Exercises 1-10, the data come from a random sample of 20 companies of the NASDAQ 100 taken on June 8, 2017. (Data from: www.morningstar.com.)
For Exercises 1 and 2, (a) write a frequency distribution; (b) draw a histogram.
The variable is the price of the stock (rounded to the nearest dollar).
| 123 | 35 | 76 | 38 |
| 45 | 62 | 50 | 111 |
| 180 | 108 | 65 | 46 |
| 66 | 100 | 64 | 144 |
| 57 | 107 | 48 | 110 |
(a)
Explanation of Solution
Given:
Consider the data came from a random sample of 20 companies of NASDAQ 100
| 123 | 35 | 76 | 38 |
| 45 | 62 | 50 | 111 |
| 180 | 108 | 65 | 46 |
| 66 | 100 | 64 | 144 |
| 57 | 107 | 48 | 110 |
Calculation:
To draw the frequency table, sort the data set
35,38,45, 46,48,50,57,62,64,65,66,76,100,107,108,110,111,123,144,180
There is no repetition of data therefore the frequency of occurrence is 1 for all the data set hence the frequency distribution is
| 35 | 1 | 66 | 1 |
| 38 | 1 | 76 | 1 |
| 45 | 1 | 100 | 1 |
| 46 | 1 | 107 | 1 |
| 48 | 1 | 108 | 1 |
| 50 | 1 | 110 | 1 |
| 57 | 1 | 111 | 1 |
| 62 | 1 | 123 | 1 |
| 64 | 1 | 144 | 1 |
| 65 | 1 | 180 | 1 |
(b)
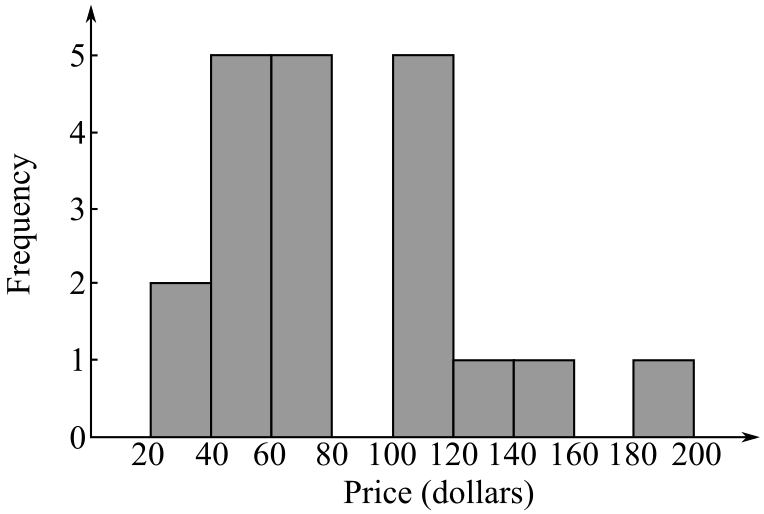
To graph: Draw the histogram corresponding to the corresponding to the data came from a random sample of 20 companies of NASDAQ 100.
Explanation of Solution
Given:
Consider the data came from a random sample of 20 companies of NASDAQ 100
| 123 | 35 | 76 | 38 |
| 45 | 62 | 50 | 111 |
| 180 | 108 | 65 | 46 |
| 66 | 100 | 64 | 144 |
| 57 | 107 | 48 | 110 |
Calculation:
To draw the frequency table sort the data set
35,38,45, 46,48,50,57,62,64,65,66,76,100,107,108,110,111,123,144,180
There is no repetition of data therefore the frequency of occurrence is 1 for all the data set hence the frequency distribution is
| 35 | 1 | 66 | 1 |
| 38 | 1 | 76 | 1 |
| 45 | 1 | 100 | 1 |
| 46 | 1 | 107 | 1 |
| 48 | 1 | 108 | 1 |
| 50 | 1 | 110 | 1 |
| 57 | 1 | 111 | 1 |
| 62 | 1 | 123 | 1 |
| 64 | 1 | 144 | 1 |
| 65 | 1 | 180 | 1 |
| Range | Frequency |
| 20-40 | 2 |
| 40-60 | 5 |
| 60-80 | 5 |
| 80-100 | 0 |
| 100-120 | 5 |
| 120-140 | 1 |
| 140-160 | 1 |
| 160-180 | 0 |
| 180-200 | 1 |
The y-axis represents frequency with a scale of

Hence, the histogram corresponding to the corresponding to the data came from a random sample of 20 companies of NASDAQ 100 is drawn.
Want to see more full solutions like this?
Chapter 10 Solutions
MyLab Math with Pearson eText -- Standalone Access Card -- for Mathematics with Applications in the Management, Natural, and Social Sciences (12th Edition)
- Find the distance from the point (-9, -3, 0) to the line ä(t) = (−4, 1, −1)t + (0, 1, −3) .arrow_forward1 Find a vector parallel to the line defined by the parametric equations (x(t) = -2t y(t) == 1- 9t z(t) = -1-t Additionally, find a point on the line.arrow_forwardFind the (perpendicular) distance from the line given by the parametric equations (x(t) = 5+9t y(t) = 7t = 2-9t z(t) to the point (-1, 1, −3).arrow_forward
- Let ä(t) = (3,-2,-5)t + (7,−1, 2) and (u) = (5,0, 3)u + (−3,−9,3). Find the acute angle (in degrees) between the lines:arrow_forwardNo chatgpt pls will upvotearrow_forwardA tank initially contains 50 gal of pure water. Brine containing 3 lb of salt per gallon enters the tank at 2 gal/min, and the (perfectly mixed) solution leaves the tank at 3 gal/min. Thus, the tank is empty after exactly 50 min. (a) Find the amount of salt in the tank after t minutes. (b) What is the maximum amount of salt ever in the tank?arrow_forward
- Draw a picture of a normal distribution with mean 70 and standard deviation 5.arrow_forwardWhat do you guess are the standard deviations of the two distributions in the previous example problem?arrow_forward1 What is the area of triangle ABC? 12 60° 60° A D B A 6√√3 square units B 18√3 square units 36√3 square units D 72√3 square unitsarrow_forward
- Each answer must be justified and all your work should appear. You will be marked on the quality of your explanations. You can discuss the problems with classmates, but you should write your solutions sepa- rately (meaning that you cannot copy the same solution from a joint blackboard, for exam- ple). Your work should be submitted on Moodle, before February 7 at 5 pm. 1. True or false: (a) if E is a subspace of V, then dim(E) + dim(E) = dim(V) (b) Let {i, n} be a basis of the vector space V, where v₁,..., Un are all eigen- vectors for both the matrix A and the matrix B. Then, any eigenvector of A is an eigenvector of B. Justify. 2. Apply Gram-Schmidt orthogonalization to the system of vectors {(1,2,-2), (1, −1, 4), (2, 1, 1)}. 3. Suppose P is the orthogonal projection onto a subspace E, and Q is the orthogonal projection onto the orthogonal complement E. (a) The combinations of projections P+Q and PQ correspond to well-known oper- ators. What are they? Justify your answer. (b) Show…arrow_forwardpleasd dont use chat gptarrow_forward1. True or false: (a) if E is a subspace of V, then dim(E) + dim(E+) = dim(V) (b) Let {i, n} be a basis of the vector space V, where vi,..., are all eigen- vectors for both the matrix A and the matrix B. Then, any eigenvector of A is an eigenvector of B. Justify. 2. Apply Gram-Schmidt orthogonalization to the system of vectors {(1, 2, -2), (1, −1, 4), (2, 1, 1)}. 3. Suppose P is the orthogonal projection onto a subspace E, and Q is the orthogonal projection onto the orthogonal complement E. (a) The combinations of projections P+Q and PQ correspond to well-known oper- ators. What are they? Justify your answer. (b) Show that P - Q is its own inverse. 4. Show that the Frobenius product on n x n-matrices, (A, B) = = Tr(B*A), is an inner product, where B* denotes the Hermitian adjoint of B. 5. Show that if A and B are two n x n-matrices for which {1,..., n} is a basis of eigen- vectors (for both A and B), then AB = BA. Remark: It is also true that if AB = BA, then there exists a common…arrow_forward
 Holt Mcdougal Larson Pre-algebra: Student Edition...AlgebraISBN:9780547587776Author:HOLT MCDOUGALPublisher:HOLT MCDOUGAL
 Glencoe Algebra 1, Student Edition, 9780079039897...AlgebraISBN:9780079039897Author:CarterPublisher:McGraw Hill
 Big Ideas Math A Bridge To Success Algebra 1: Stu...AlgebraISBN:9781680331141Author:HOUGHTON MIFFLIN HARCOURTPublisher:Houghton Mifflin Harcourt


