
Concept explainers
Videos
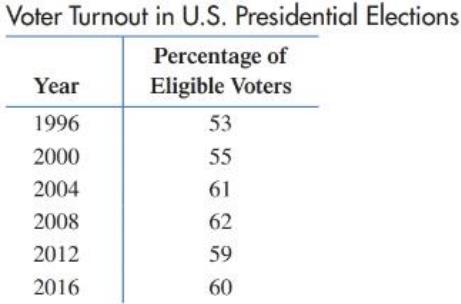
Use a bar graph and a broken-line graph to graph the data on voter turnout, as a percentage of the population eligible to vote, in U.S. presidential elections.
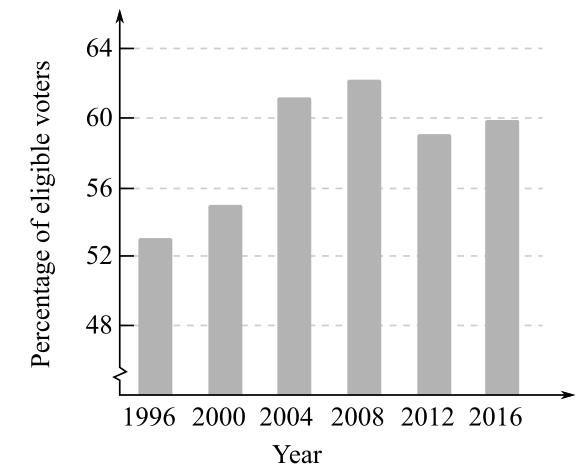
To graph:The data given in the following table for the voter turnout, as a percentage of the population eligible to vote, in U.S. presidential elections using a bar graph,
Explanation of Solution
Graph:
Consider the given table,
The percentage of eligible voters corresponding to the different years is known as the frequency. The frequencies are represented on the
Use the frequencies to draw the graph of the given data.
Thus, the bar graph of the given frequency table is,
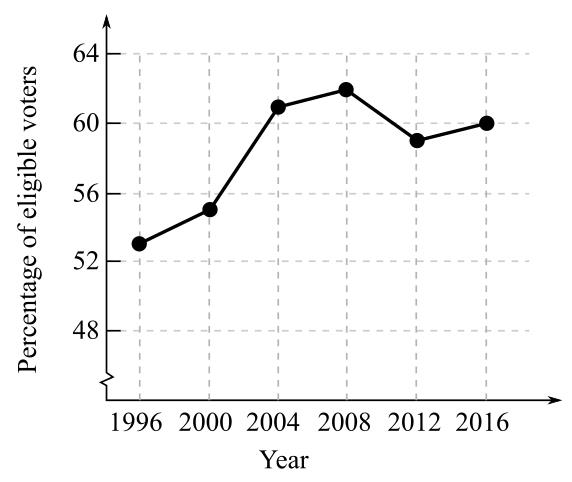
To graph:The data given in the following table for the voter turnout, as a percentage of the population eligible to vote, in U.S. presidential elections using a broken-line graph.
Explanation of Solution
Graph:
Consider the given table,
Voter Turnout in US Presidential Elections
A broken-line graph can be obtained from a vertical bar-graph by joining the mid-points of the tops of consecutive bars with straight lines.
The percentage of eligible voters corresponding to the different years is known as the frequency. The frequencies are represented on the
Use the frequencies to draw the graph of the given data.
Thus, the bar graph of the given frequency table is,
Want to see more full solutions like this?
Chapter 10 Solutions
Finite Mathematics for Business, Economics, Life Sciences and Social Sciences
Additional Math Textbook Solutions
Calculus: Early Transcendentals (2nd Edition)
Introductory Statistics
Elementary Statistics
Elementary Statistics (13th Edition)
Algebra and Trigonometry (6th Edition)
Basic Business Statistics, Student Value Edition


- An article in Business Week discussed the large spread between the federal funds rate and the average credit card rate. The table below is a frequency distribution of the credit card rate charged by the top 100 issuers. Credit Card Rates Credit Card Rate Frequency 18% -23% 19 17% -17.9% 16 16% -16.9% 31 15% -15.9% 26 14% -14.9% Copy Data 8 Step 1 of 2: Calculate the average credit card rate charged by the top 100 issuers based on the frequency distribution. Round your answer to two decimal places.arrow_forwardCan you help me with this problem knowing the answer is 0.2353arrow_forwardi need help please . and please dont use chat gpt i am trying to learn and see the mistake i did when solving minearrow_forward
- The radius of a sphere decreases at a rate of 3 m/s. Find the rate at which the surface area decreases when the radius is 8 m. Answer exactly or round to 2 decimal places. The surface area decreases at a rate of m²/sarrow_forwardFind PS. P 76° e S Type your answer... 39 28°arrow_forwardPlease could you check my answersarrow_forward
- Let Y₁, Y2,, Yy be random variables from an Exponential distribution with unknown mean 0. Let Ô be the maximum likelihood estimates for 0. The probability density function of y; is given by P(Yi; 0) = 0, yi≥ 0. The maximum likelihood estimate is given as follows: Select one: = n Σ19 1 Σ19 n-1 Σ19: n² Σ1arrow_forwardPlease could you help me answer parts d and e. Thanksarrow_forwardQ4 3 Points Consider the matrices A = B = C = 2 3 View them as elements of the vector space M2x2 of all 2 x 2 matrices. Determine if C is an element of Span{A, B}. Show work to justify your answer. (Hint: You may want to remind yourself what the definition of Span{A, B} is.) Please select file(s) Select file(s) Save Answerarrow_forward
- Q2 29 2 Points Q2.1 1 Point [120] Let A 120 and v = 001 v is an element of Col A. v is not an element of Col A. Save Answer Q2.2 1 Point [12 0 Let A 120 and w= [001] w is an element of Nul A. Ow is not an element of Nul A. Save Answer 1 Select the statement that is true. 0 Select the statement that is true.arrow_forwardQ3 3 Points In the vector space V = P₂ of all polynomials of degree at most 2, consider the elements Pi(t)=1+t, P2(t) = 1-t, Ps(t)=1+2t+t². Determine if it is possible to write the polynomial q(t) = t² as a linear combination of Pi(t), p2(t), ps(t). If possible, show which linear combination of p₁(t), p2(t), ps(t) is equal to q(t) . If not possible, explain why. Show all of your work. Please select file(s) Select file(s) Save Answerarrow_forwardWhen fitting the model E[Y] = Bo+B1x1,i + B2x2; to a set of n = 25 observations, the following results were obtained using the general linear model notation: and 25 219 10232 551 XTX = 219 10232 3055 133899 133899 6725688, XTY 7361 337051 (XX)-- 0.1132 -0.0044 -0.00008 -0.0044 0.0027 -0.00004 -0.00008 -0.00004 0.00000129, Construct a multiple linear regression model Yin terms of the explanatory variables 1,i, x2,i- a) What is the value of the least squares estimate of the regression coefficient for 1,+? Give your answer correct to 3 decimal places. B1 b) Given that SSR = 5550, and SST=5784. Calculate the value of the MSg correct to 2 decimal places. c) What is the F statistics for this model correct to 2 decimal places?arrow_forward
 Glencoe Algebra 1, Student Edition, 9780079039897...AlgebraISBN:9780079039897Author:CarterPublisher:McGraw Hill
 Holt Mcdougal Larson Pre-algebra: Student Edition...AlgebraISBN:9780547587776Author:HOLT MCDOUGALPublisher:HOLT MCDOUGAL
 Big Ideas Math A Bridge To Success Algebra 1: Stu...AlgebraISBN:9781680331141Author:HOUGHTON MIFFLIN HARCOURTPublisher:Houghton Mifflin Harcourt
 Trigonometry (MindTap Course List)TrigonometryISBN:9781305652224Author:Charles P. McKeague, Mark D. TurnerPublisher:Cengage Learning