
Concept explainers
Videos
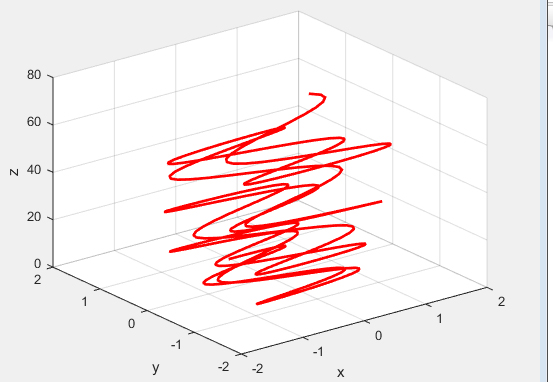
To plot:
The position of a moving particle as a
Answer to Problem 1P
Solution:
The program is stated as follows.
Explanation of Solution
The given equation is,
The
Write the MATLAB code to plot the position of a moving particle as a function of time from the equation,
MATLAB Code:
t = 0:0.1:30;
%Define the variable t.
x = [((t-15)./100)+1].*sin(3.*t);
%Define the variable x.
y = [((t-15)./100)+1].*cos(0.8.*t);
%Define the variable y.
z = 0.4.*t.^(3/2);
%Define the variable z.
plot3(x,y,z,'r','linewidth',2)
grid on
xlabel('x'); ylabel('y'); zlabel('z')
Save the MATLAB script with the name, Chapter10_29864_10_1P.m in the current folder. Execute the script by typing the script name at the command window to get the code that plots the position of a moving particle as a function of time from the equation,
Result:
Conclusion:
Therefore, the program is stated above.
Want to see more full solutions like this?
Chapter 10 Solutions
EBK MATLAB: AN INTRODUCTION WITH APPLIC


- Please show all the steps!arrow_forward10-3) similar to Lathi & Ding, Prob. P.6.3-7 The Fourier transform P(f) of a the basic pulse p(t) used in a certain binary communication is shown in the figure below: P(f) 1 0.5 0 f₁ = 0.8 √₂ = 1.2 f, MHz (a) From the shape of P(f), explain at what pulse rate this pulse would satisfy Nyquist's first criterion. (b) Assuming that the pulse is a raised-cosine pulse, find its rolloff factor. (c) Find p(t) and verify that this pulse satisfies Nyquist's first criterion in the time domain. (d) Show how rapidly the pulse decays as a function of t, (i.e., what power of t does the envelope obey for large time values).arrow_forwardDon't use ai to answer I will report you answerarrow_forward
- Don't use ai to answer I will report you answerarrow_forwardDon't use ai to answer I will report you answerarrow_forwardChoose the correct answer for from the following sentences: 1. The purpose of the microprocessor is to control b. memory c. processing d. tasks a. switches 2. Which of the following instructions represents base-plus-index addressing mode? a. MOV AL,[BX] b. MOV AL,[SI] c. MOV AL,BX d. MOV AL,[BX+SI] 3. The BIU pre-fetches the instruction from memory and store them in b. memory c. stack d. queue a. register 4. Which function is used to control the PWM (Pulse Width Modulation) on the Arduino output pin? a. digitalRead() b. analogRead() c. digitalWrite() 5. Which port in the PIC16F877A has an 8 external interrupt inputs? a. Port-A b. Port-C c. Port-B d. analogWrite() d. Port-D d. 4KByte 6. How much Flash EEPROM memory program found in the PIC16F877A microcontroller? a. 32KByte b. 16KByte c. 8KBytearrow_forward
- Solve and select the correct answer: 2. For a random variable X with pdf: p(x) value of x is = 119 10 for -5≤x≤5. The mean (a) -75 (b) 10 (c) 0 (d) 75 3. Is the matrix A = = [1] orthogonal? Find the rank of A? 0 (a) YES, -1 (b) NO, 2 (c) YES, 2 (d) NO, -1 4. L{et sin(3t)u(t)) = (a) s-3 (s-2)²+9 2 (b) (5-3)² (c) (s-3)²+4 S-2 3 (s-2)²+9 (d) (5-2)²+9 = 5. Given that x is a constant. Choose all the correct solutions for [∞ (AB)] = (a) (AB)T (b) x ATBT (c) α BTAT (d) x (AB)Tarrow_forwardDO NOT WANT AI WILL REJECTarrow_forward3. Roughly sketch the root locus for the following locations of open-loop poles and zeros. You just need to show the shape of the root locus; you do not calculate the asymptote, break-in, and break-away points. ☑ (a) (b) ☑ Φ ① $3 (c)arrow_forward
 Introductory Circuit Analysis (13th Edition)Electrical EngineeringISBN:9780133923605Author:Robert L. BoylestadPublisher:PEARSON
 Delmar's Standard Textbook Of ElectricityElectrical EngineeringISBN:9781337900348Author:Stephen L. HermanPublisher:Cengage Learning
 Programmable Logic ControllersElectrical EngineeringISBN:9780073373843Author:Frank D. PetruzellaPublisher:McGraw-Hill Education
 Fundamentals of Electric CircuitsElectrical EngineeringISBN:9780078028229Author:Charles K Alexander, Matthew SadikuPublisher:McGraw-Hill Education
 Electric Circuits. (11th Edition)Electrical EngineeringISBN:9780134746968Author:James W. Nilsson, Susan RiedelPublisher:PEARSON
 Engineering ElectromagneticsElectrical EngineeringISBN:9780078028151Author:Hayt, William H. (william Hart), Jr, BUCK, John A.Publisher:Mcgraw-hill Education,