Effect of Paternal Grandmother's Food Supply on Infant Mortality Widely available historical data on periods of famine show that before the industrial revolution, a failed harvest in one autumn often led to severe food shortages the following winter. Retrospective studies have correlated infant mortality with the abundance or food during a grandparent's child hood. FIGURE 10.11 shows results from one or these studies.

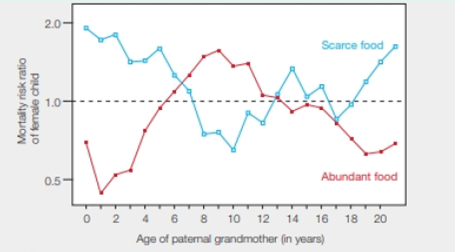
FIGURE 10.11 Relative risk of early death of female child, correlated with the age at which her paternal grandmother experienced a winter with a food supply, that was scarce (blue) or abundant (red) during childhood. The dotted line represents no difference in risk of mortality. A value above the line means increased risk; one below the line indicates reduced risk.
Compare the mortality risk of girls whose paternal grandmothers ate well at age 2 with girls whose grandmothers experienced famine at the same age. Which girl was more likely to die early? How much more likely was she to die?
To compare: The mortality risk of girls with the food habit of their parental grandmothers.
Introduction: The parental eating behavior has a great influence on the mortality rate of the offspring. The survival of the humans is greatly affected by the food scarcity faced by their ancestors. An individual who has faced famine or starvation at a particular period can be correlated with the infant mortality rate.
Explanation of Solution
As given in Fig. 10.11, “Relative risk of early death of a female child” can be correlated with the age of her parental grandmother food scarcity or food abundance.
According to the given data, during the industrial revolution, a food shortage was experienced in winter due to the failure in harvesting in the autumn season.
The given graph shows, the age of parental grandmother in X- axis and mortality risk ratio of the female child in the Y- axis. The blue line in the graph depicts the mortality rate and parental grandmother who faced food scarcity at the different age. And the red line in the graph depicts the mortality rate and parental grandmother who has abundant of food at the different age. A dotted line which given in the graph represents that there is no difference in the risk of mortality. If the value goes above the dotted line, the risk increases and value below the line the risk decreases.
A comparison is done between the mortality risks of girls correlated with the eating habits of their parental grandmother at the age 2. According to the given graph, a girl whose grandmother experienced food crisis at the age of two is more likely to die earlier than the girl whose parental grandmother got abundant food at the age of 2. The female grandchild’s mortality risk ratio is one and one and half time greater than the average.
The girl child whose parental grandmother faced food crisis at age 2 is one and one-half times more likely to die early.
Want to see more full solutions like this?
Chapter 10 Solutions
Biology: The Unity and Diversity of Life (Looseleaf)
Additional Science Textbook Solutions
SEELEY'S ANATOMY+PHYSIOLOGY
Genetics: From Genes to Genomes
Campbell Essential Biology (7th Edition)
HUMAN ANATOMY
Microbiology Fundamentals: A Clinical Approach
- As a medical professional, it is important to be able to discuss how genetic processes such as translation regulation can directly affect patients. Think about some situations that might involve translation regulation. Respond to the following in a minimum of 175 words: Why is translation regulation important? What are some examples of translation regulation in humans? Select one of the examples you provided and explain what happens when translation regulation goes wrong.arrow_forwardThe metabolic pathway below is used for the production of the purine nucleotides adenosine monophosphate (AMP) and guanosine monophosphate (GMP) in eukaryotic cells. Assume each arrow represents a reaction catalyzed by a different enzyme. Using the principles of feedback inhibition, propose a regulatory scheme for this pathway that ensures an adequate supply of both AMP and GMP, and prevents the buildup of Intermediates A through G when supplies of both AMP and GMP are adequate.arrow_forwardQUESTION 27 Label the structures marked A, B, C and explain the role of structure A. W plasma membrane For the toolbar, press ALT+F10 (PC) or ALT+FN+F10 (Mac). BIUS ☐ Paragraph Π " ΩΘΗ Β Open Sans, a... 10pt EEarrow_forward
- examples of synamptomorphyarrow_forwardexamples of synamtomorphy.arrow_forwardE. Bar Graph Use the same technique to upload the completed image. We will use a different type of graph to derive additional information from the CO2 data (Fig A1.6.2) 1. Calculate the average rate of increase in COz concentration per year for the time intervals 1959-1969, 1969- 1979, etc. and write the results in the spaces provided. The value for 1959-1969 is provided for you as an example. 2. Plot the results as a bar graph. The 1959-1969 is plotted for you. 3. Choose the graph that looks the most like yours A) E BAR GRAPH We will use a different type of graph to derive additional information from the CU, data (rig. nive). Average Yearly Rate of Observatory, Hawall interval Rate of increase per year 1959-1969 0.9 1969-1979 1979-1989 1989-1999 1999-2009 Figure A1.6.2 1999-2009 *- mrame -11- -n4 P2 جية 1989-1999 1979-1989 1969-1979 1959-1969 This bar drawn for you as an example 1.0 CO, Average Increase/Year (ppmv) B) E BAR GRAPH We will use a different type of graph to derive…arrow_forward
- Use the relationships you just described to compute the values needed to fill in the blanks in the table in Fig A1.4.1 depth (a) 1.0 cml 0.7 cml cm| base dimensions (b, c)| 1.0 cm| 1.0 cm| 1.0 cm 1.0 cm| 1.0 cm| 1.0 cm volume (V) 1.0_cm' cm'| cm'| density (p) 1.0 g/cm'| 1.0 g/cm 1.0 g/cm' mass (m)| 0.3 g Column 1: depth at 1.0 cm volume mass Column 2: depth at 0.7 cm volume mass Column 3: unknown depth depth volumearrow_forwardSan Andreas Transform Boundary Plate Motion The geologic map below of southern California shows the position of the famous San Andreas Fault, a transform plate boundary between the North American Plate (east side) and the Pacific Plate (west side). The relative motion between the plates is indicated by the half arrows along the transform plate boundary (i.e., the Pacific Plate is moving to the northwest relative to the North American Plate). Note the two bodies of Oligocene volcanic rocks (labeled Ov) on the map in the previous page located along either side of the San Andreas Fault. These rocks are about 23.5 million years old and were once one body of rock. They have been separated by displacement along the fault. 21. Based on the offset of these volcanic rocks, what is the average annual rate of relative plate motion in cm/yr? SAF lab 2.jpg Group of answer choices 0.67 cm/yr 2 cm/yr 6.7 cm/yr 1.5 cm/yr CALIFORNIA Berkeley San Francisco K Os Q San Andreas Fault Ov…arrow_forwardThese are NOT part of any graded assignment. Are there other examples of synapomorphy. What is it called when the traits retained are similar to ancestors?arrow_forward
 Understanding Nutrition (MindTap Course List)Health & NutritionISBN:9781337392693Author:Eleanor Noss Whitney, Sharon Rady RolfesPublisher:Cengage Learning
 Nutrition Through The Life CycleHealth & NutritionISBN:9781337919333Author:Brown, Judith E.Publisher:Cengage Learning,
 Biology: The Unity and Diversity of Life (MindTap...BiologyISBN:9781305073951Author:Cecie Starr, Ralph Taggart, Christine Evers, Lisa StarrPublisher:Cengage Learning
 Biology: The Dynamic Science (MindTap Course List)BiologyISBN:9781305389892Author:Peter J. Russell, Paul E. Hertz, Beverly McMillanPublisher:Cengage Learning
 Biology Today and Tomorrow without Physiology (Mi...BiologyISBN:9781305117396Author:Cecie Starr, Christine Evers, Lisa StarrPublisher:Cengage Learning


