
How the following events would affect equilibrium real
Concept introduction:
Aggregate
Short run ASC (SRAS) Curve- The relationship between the quantity of the real GDP supplied by the economy at different price levels in a period when the all factors of production are not variable and increased prices do not culminate into increased input prices, is represented by the Short Run ASC or SRAS Curve. This is a
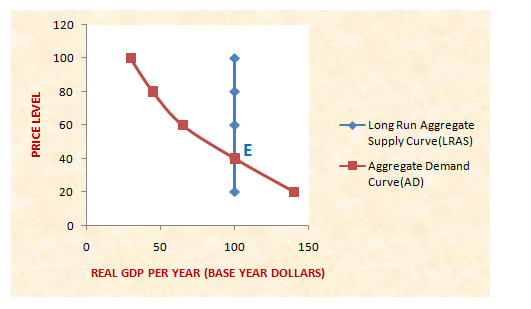
Long Run Aggregate Supply Curve(LRAS) Curve- In the long run with all factors variable, the increased price level translates into higher cost of living and higher input prices. The producers adjust the production levels to meet the increased cost of production. Thus, in the long run the supply does not change in reaction to changes in the aggregate demand. This long run relationship between the Aggregate supply and price level is the Long Run Aggregate Supply (LRAS) Curve and is graphically represented as a straight line parallel to the Y-Axis implying perfect inelasticity of supply.
Long Run Equilibrium and the AS-AD Model- The point of intersection of the SRAS Curve, the LRAS Curve and the AD Curve is studied under the AS-AD Model and depicts the long run equilibrium in the economy.
The figure below depicts an economy in a state of long run equilibrium at Point E where LRAS curve equals the AD curve.
Want to see the full answer?
Check out a sample textbook solution
Chapter 10 Solutions
Economics Today: The Macro View (19th Edition) (Pearson Series in Economics)

- Suppose there is a new preventative treatment for a common disease. If you take the preventative treatment, it reduces the average amount of time you spend sick by 10%. The optimal combination of Z (home goods) and H (health goods). both may increase both may increase or one may stay the same while the other increases. both may decrease H may increase; Z may not change Z may increase; H may decreasearrow_forwardIn the Bismarck system,. may arise. neither selection both adverse and risk selection ☑ adverse selection risk selectionarrow_forwardPls fill out/explain to me these notes and explanations, thanksarrow_forward
- Simple explanations plsarrow_forwardThis question examines the relationship between the Indian rupee (Rs) and the US dollar ($). We denote the exchange rate in rupees per dollar as ERS/$. Suppose the Bank of India permanently decreases its money supply by 4%. 1. First, consider the effect in the long run. Using the following equation, explain how the change in India's money supply affects the Indian price level, PIN, and the exchange rate, ERS/$: AERS/STIN ERS/$ - ·TUS = (MIN - 9IN) - (Mus - gus). MIN 2. How does the decrease in India's money supply affect the real money supply, in the long PIN run. 3. Based on your previous answer, how does the decrease in the Indian money supply affect the nominal interest rate, UN, in the long run? (hint: M = L(i)Y hold in the long run) 4. Illustrate the graphs to show how a permanent decrease in India's money supply affects India's money and FX markets in the long run. (hint: you may refer to the figures on lecture slides #5, titled "Analysis in the long run.") 5. Illustrate the…arrow_forwardPlease explain the concept/what this fill in graph, thanksarrow_forward
- Elasticity Problems Cross Price Elasticity (Exy) (QDX-QDo/[(QDN+QDDA)/2] (P-POR/[(PNE+POB)/2]¯¯ 11. QD of good A falls from 100 to 90 as the price of good B rose from $10 to $20. Calculate coefficient: (90-100) [(90+100) 21-10/95-105 - -.158 (20-10)/[(20+10)/2] 10/15 .667 Cite Elasticity: inclastic Typs of good: complement 12. QD of good A rose from 300 to 400 as the price good K increased from $1 to $2. Calculate coefficient Cite Elasticity: Ixps of reed: 13. QD for good I falls from 2000 to 1500 units as price of good Krose from $10 to $15. Calculate coefficient: Cite Elasticity: Type of good: 14. QD for good X rose from 100 to 101 units as price of good Y increases from, $8 to $15. Calculate coefficient: Cite Elasticity: Type of paed: Page 124 (368) Value of Coefficient Description Positive (0) Negative (L*0) Type of Good(s) Substitute Quantity Demanded of W changes in same direction a change in price if Z Quantity Demanded of W changes in opposite direction as change in price if Z…arrow_forwardUse production theory to graphically illustrate the case in which a medical innovation improves health without any change in the consumption of medical care.arrow_forwardAccording to Lee et al. (2009), the incremental cost-effectiveness ratio comparing the current dialysis treatment to the next least cost dialysis treatment is $61,294 per life year and $129,090 per QALY. Can you account for the different estimates?arrow_forward

 Principles of Economics (12th Edition)EconomicsISBN:9780134078779Author:Karl E. Case, Ray C. Fair, Sharon E. OsterPublisher:PEARSON
 Engineering Economy (17th Edition)EconomicsISBN:9780134870069Author:William G. Sullivan, Elin M. Wicks, C. Patrick KoellingPublisher:PEARSON
 Principles of Economics (MindTap Course List)EconomicsISBN:9781305585126Author:N. Gregory MankiwPublisher:Cengage Learning
 Managerial Economics: A Problem Solving ApproachEconomicsISBN:9781337106665Author:Luke M. Froeb, Brian T. McCann, Michael R. Ward, Mike ShorPublisher:Cengage Learning
 Managerial Economics & Business Strategy (Mcgraw-...EconomicsISBN:9781259290619Author:Michael Baye, Jeff PrincePublisher:McGraw-Hill Education